Utilities and resources
This map shows the three reservoirs that supply Indianapolis with water and the facilities that treat our drinking water and waste water.

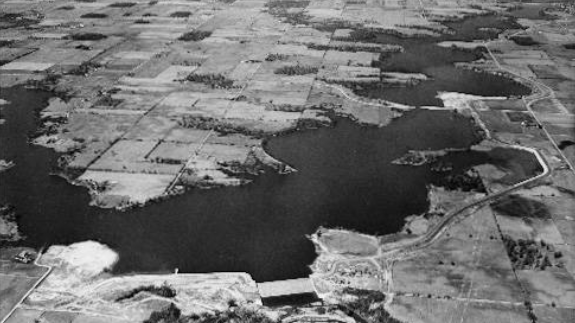
Reservoirs
Three reservoirs contain a combined 19 billion gallons of water to serve Indianapolis residents and industries.

Geist
1,800 acres | 6.3 billion gallons
Built in 1944 to regulate flow to the Fall Creek Water Treatment Facility.
Fast Facts
Average depth of 10 feet.
Water cycles through every 55 days.
Fall Creek watershed feeds 690 gallons per second into the reservoir.
58 percent of watershed is agricultural (as of 2003), so runoff can drain phosphorous into the reservoir.
Morse
1,500 acres | 7.4 billion gallons
Built in 1956 to regulate flow to the White River North Water Treatment Facility.
Fast Facts
Average depth of 15 feet.
Water cycles through every 70 days.
Cicero Creek watershed feeds 264 gallons per second into the reservoir.
77 percent of watershed is agricultural (as of 2003), so runoff can drain phosphorous into the reservoir. Water remains in the reservoir longer, which leads to higher phosphorous levels.

Eagle Creek
1,200 acres | 5.5 billion gallons
Built in 1967 for flood control. Used for drinking water since 1976.
Fast Facts
Average depth of 14 feet.
Water cycles through every 56 days.
Eagle Creek watershed feeds 240 gallons per second into the reservoir.
60 percent of watershed is agricultural (as of 2005), so runoff can drain phosphorous into the reservoir.
Citizens Reservoir
230 feet deep | 3.2 billion gallons
The new Citizens Reservoir located on Olio Road next to Geist Reservoir will provide over three billion gallons of additional water storage capacity by converting a retired 230-foot-deep limestone quarry to a dedicated water storage facility.
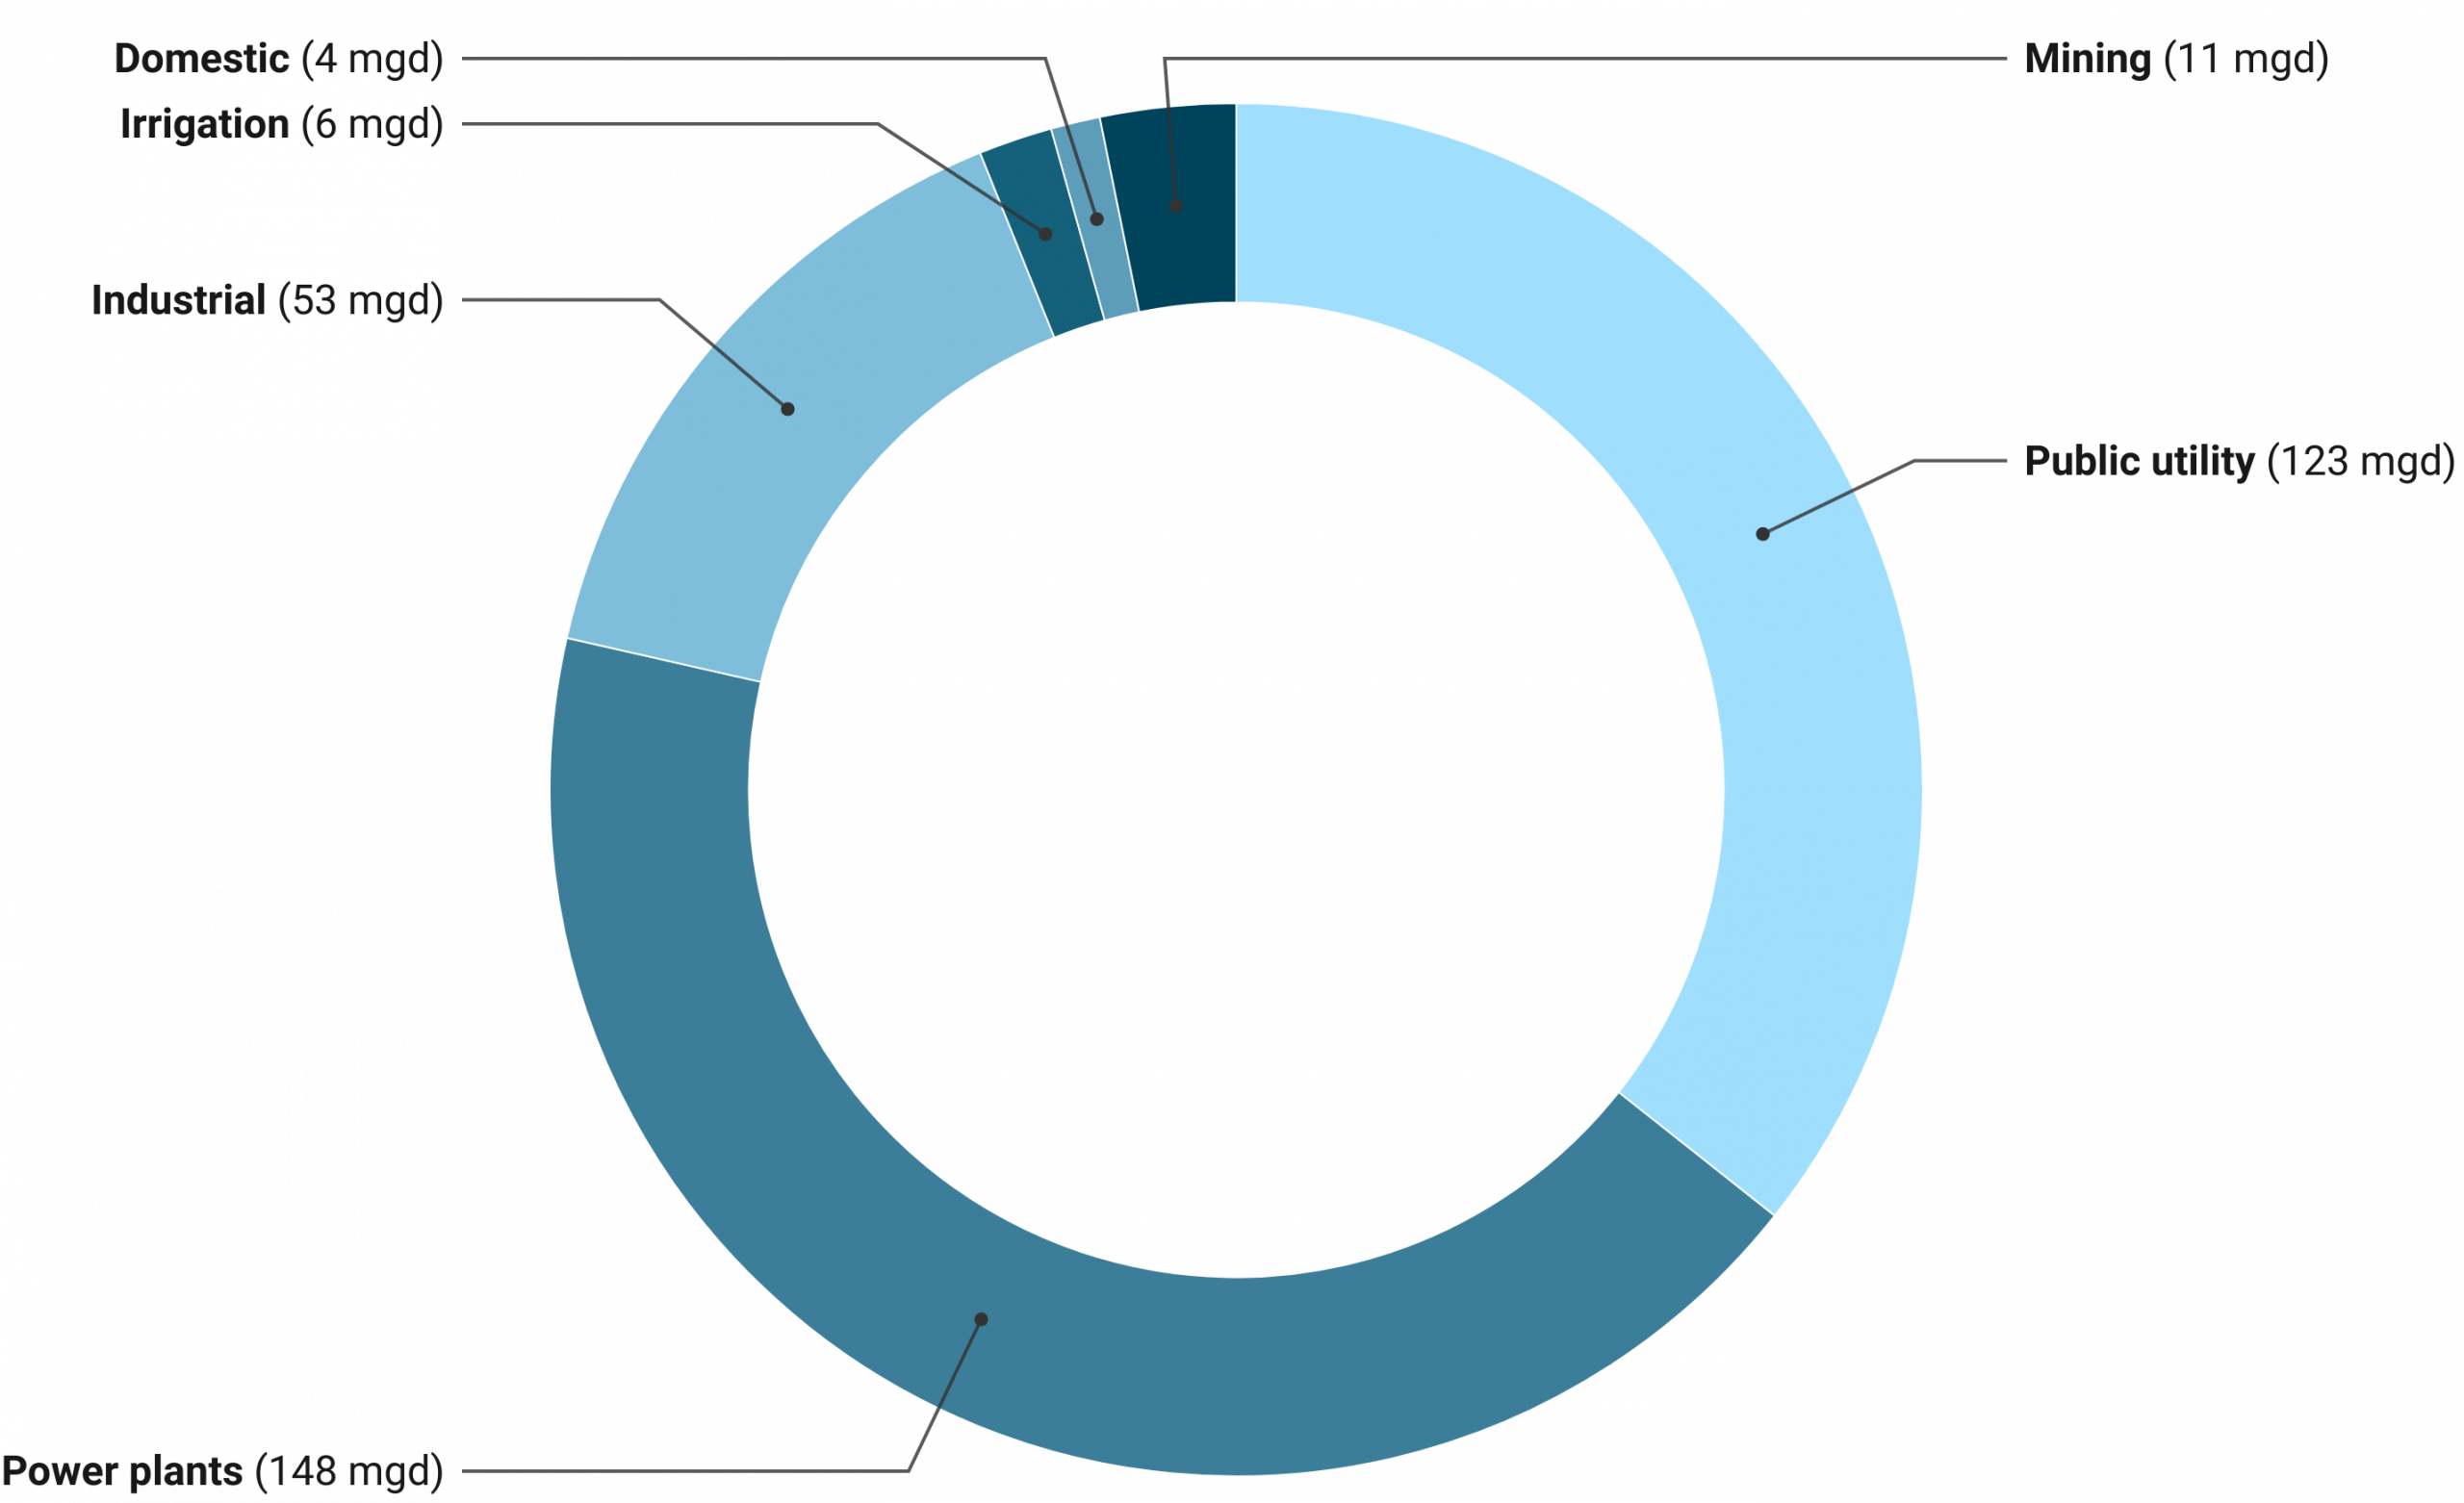
Water consumption trends
Every day, Marion County uses 264 million gallons of water. That is the full volume of our three reservoirs every 72 days.
Consumption fell by 23 percent from 1985 to 2015. Water used by power plants fell by 42 million gallons per day (mgd), while industrial use fell by 47 mgd. Water used by public utilities has also fallen (by 12 mgd).

1985
345 million gallons per day
2015
264 million gallons per day

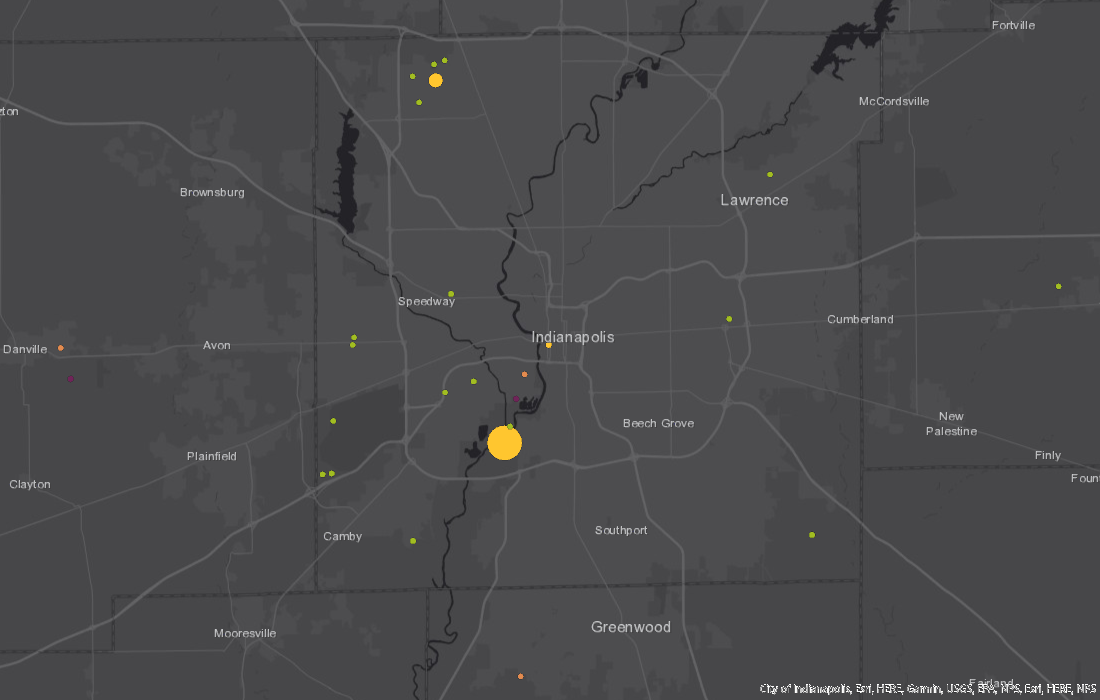
Energy
This map shows power plants. Points are colored according to energy source (solar—yellow, natural gas—green, petroleum—orange, and biomass—purple) and sized by generation capacity. View the full interactive map to see the entire state and learn more about each power plant.
Power Plants
Indianapolis Power and Light (IPL) owns a fleet of four power plants.
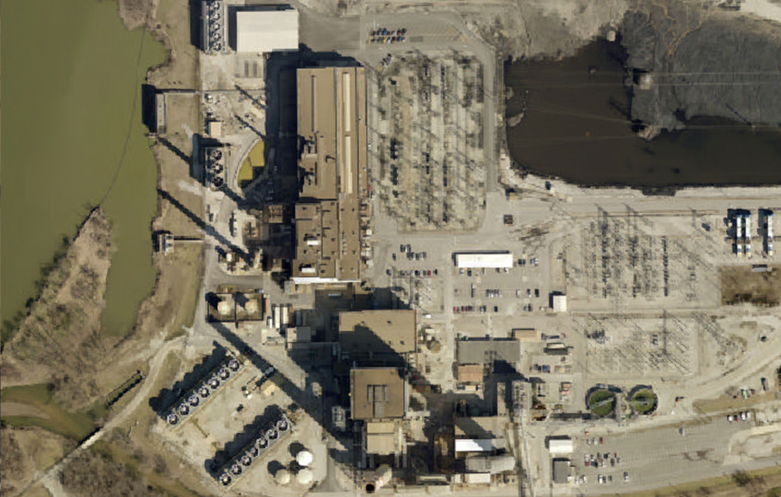
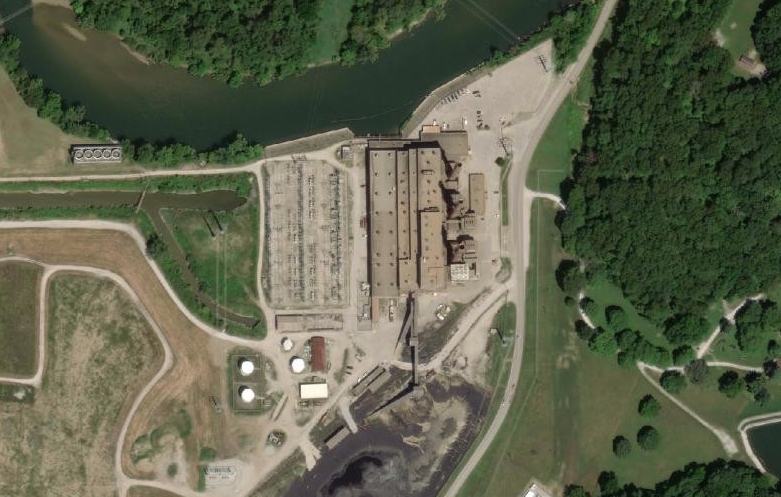
Harding Street Station
1,006 MW | Natural Gas
Built in 1931. Converted from coal to gas in 2016. Located on south side of Indianapolis.
Fast Facts
2019 greenhouse gas emissions total 650,631 metric tons.
Plant uses steam and gas turbines.
Water from the White River is cooling source.
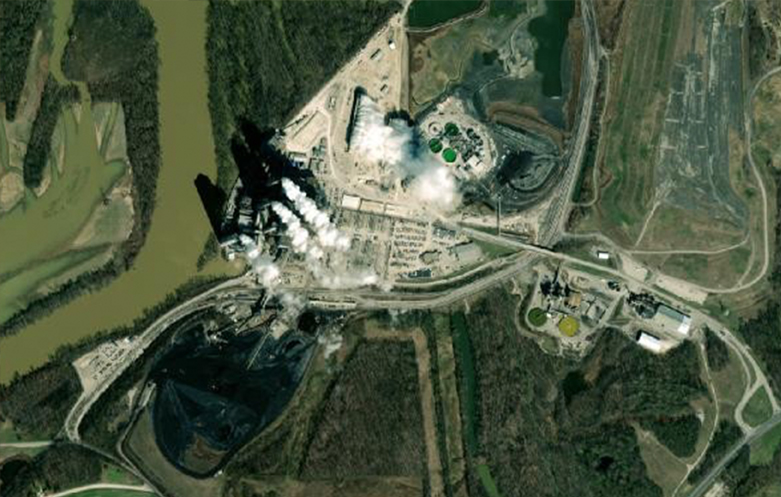
Petersburg Generating Station
1,720 MW | Coal
Built in 1967. Largest plant in IPL fleet. Located in Pike County, Indiana.
Fast Facts
2019 greenhouse gas emissions total 9,081,254 metric tons.
Plant uses steam turbines.
Water from the White River is cooling source.
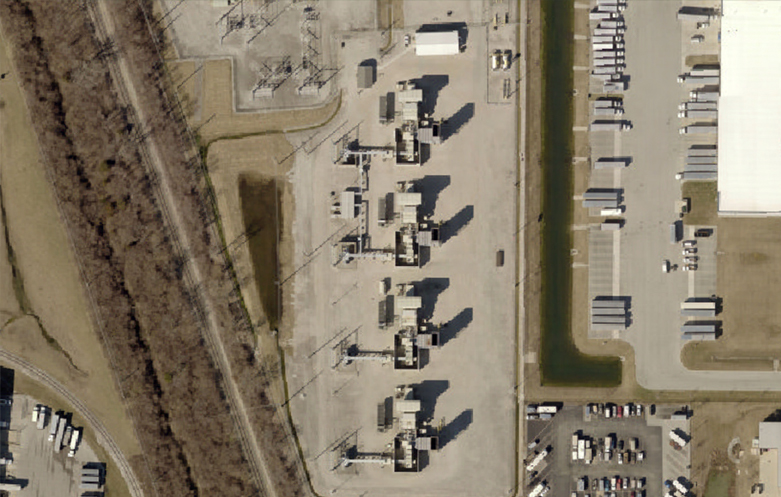
Georgetown Combustion Turbines
158 MW | Natural Gas
Built in 2000. Located on northwest side of Indianapolis.
Fast Facts
2019 greenhouse gas emissions total 81,531 metric tons.
Plant uses gas turbines.
Eagle Valley Station
671 MW | Natural Gas
Built in 2018. Replaced coal and oil units at the same site. Located near Martinsville, Indiana.
Fast Facts
2019 greenhouse gas emissions total 1,856,895 metric tons.
Plant uses gas combustion turbines and reuses that heat to spin an additional steam turbine.
Water from the White River is cooling source.
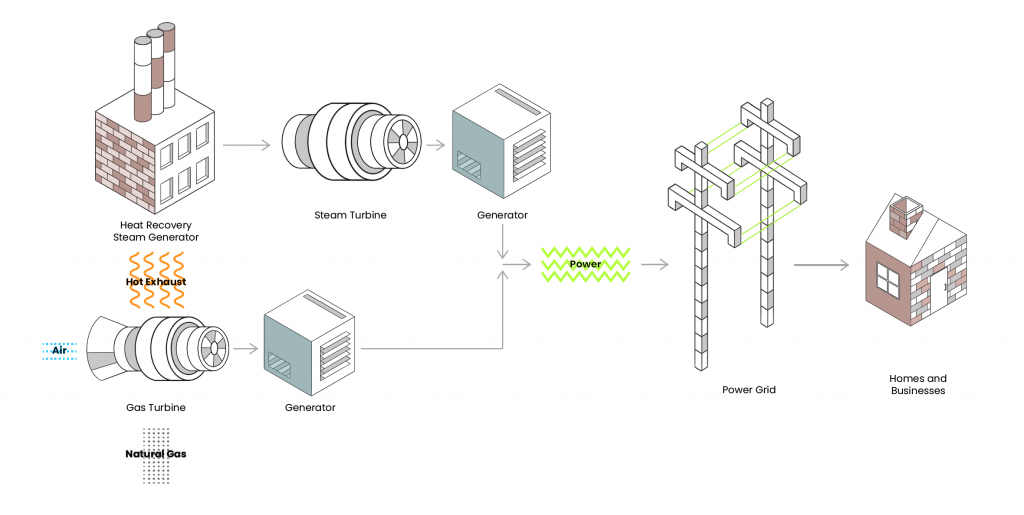
How does a combined-cycle power plant work?
Indianapolis Power and Light’s newest plant, Eagle Valley Station, uses a combined-cycle gas turbine to generate electricity from natural gas.
Traditional natural gas plants combust gas to spin a turbine, like an enormous car engine. Combined-cycle plants are more efficient. They capture the heat generated from the combustion turbine and use it to boil water to turn an additional steam turbine.
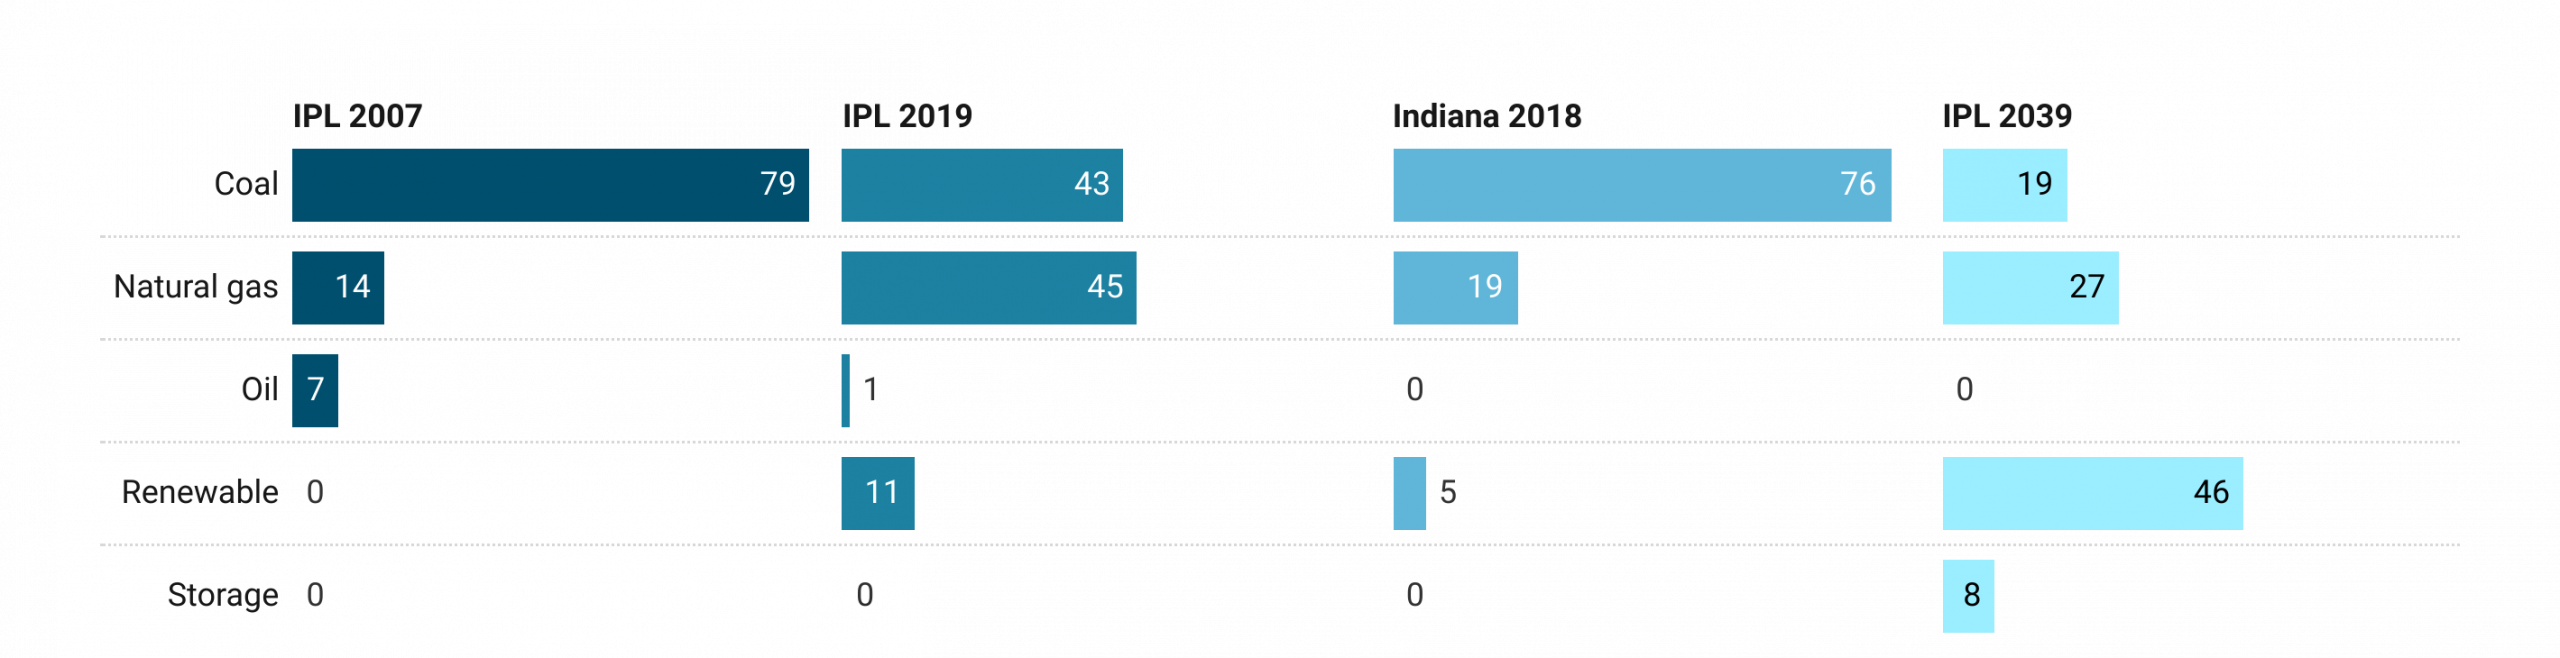
Indianapolis’ Energy Mix
The chart compares the past, present, and projected energy sources of the Indianapolis Power and Light Company to all companies’ sources in the state of Indiana. The use of coal has fallen below the state average since the conversion of multiple generators to natural gas. IPL projects that renewable energy will make up half of its energy mix by 2039.
Natural Gas
Homes and businesses use natural gas for heat and cooking fuel, while factories use natural gas to provide heat in industrial processes, to generate power, or as a raw material for chemicals and fertilizers. In the late 19th century, a natural gas deposit in east-central Indiana led to a burgeoning industrial sector, including the Muncie glass manufacturer Ball Corporation.
Natural gas pipelines enter Indiana mostly through Illinois and Ohio. Indiana uses gas, stores it, or transports it on to other states (mostly Michigan and Ohio). The state has the capacity to store 114 billion cubic feet of natural gas.
Central Indiana Pipelines
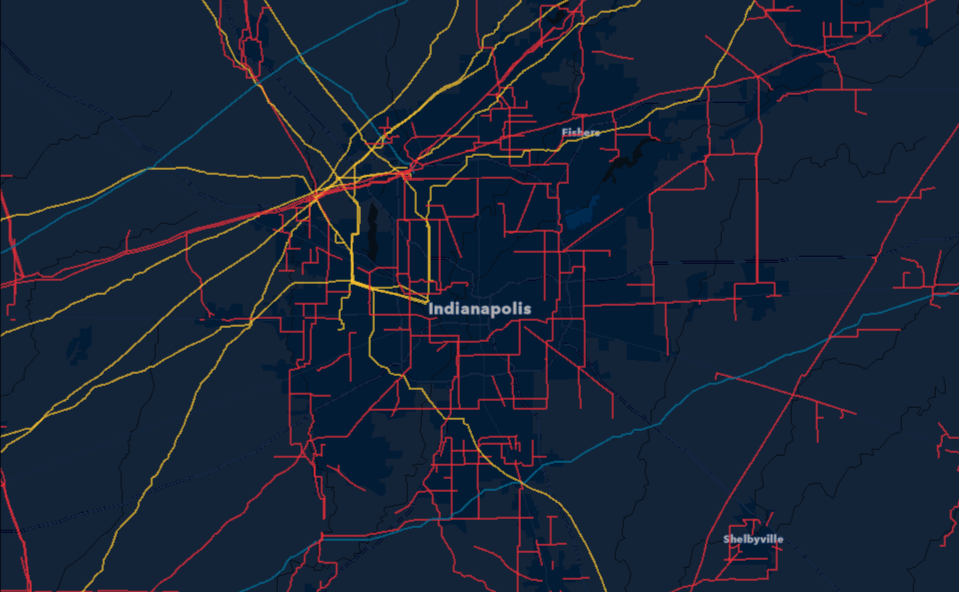
The map shows the locations of pipelines throughout Central Indiana: natural gas (red), crude oil (blue), and refined products (yellow). View the full interactive map to learn more about each pipeline.
Steam
The Perry K. Generating Station was built in 1892 as a power plant for Indianapolis. It generated just over one megawatt, or one thousandth of the current capacity of Harding Street Station. It was converted to a steam plant in 1905 and is now operated by Citizens Energy Group. The plant was converted from coal to natural gas in 2014.
The steam plant has eight boilers that produce 2 million pounds of steam per hour. This is carried to over 200 customers through 27 miles of insulated pipes. The 60,000 seat Lucas Oil Stadium and the Indiana Convention Center are both heated with steam, and IU Health Methodist Hospital uses steam to sanitize equipment.
Central Indiana Pipelines
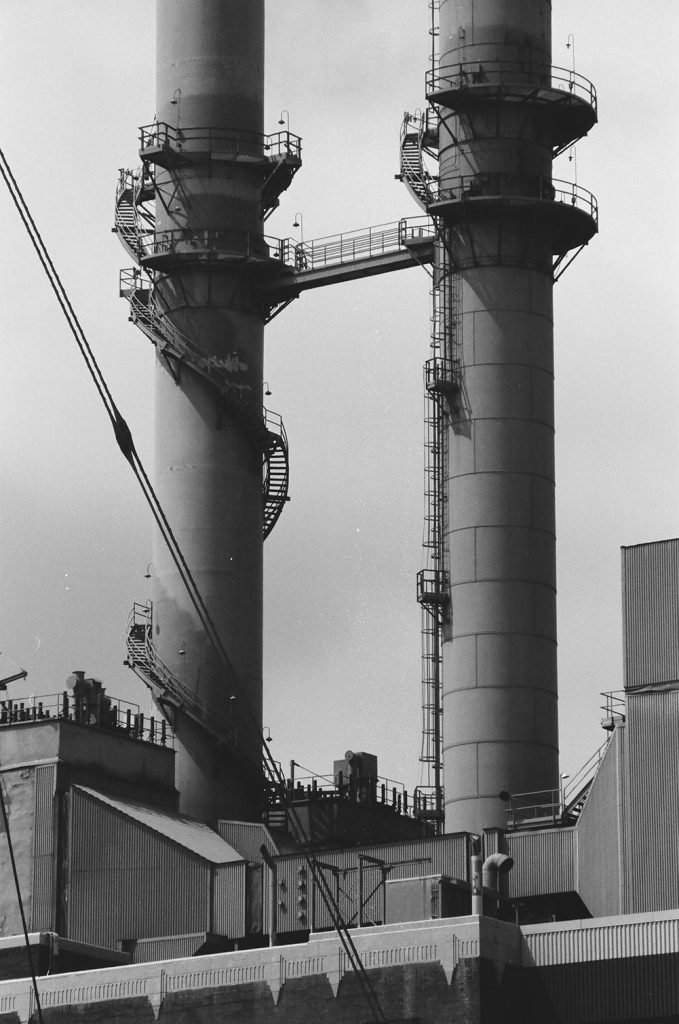
Left: The smokestacks of the Perry K. Steam Plant.
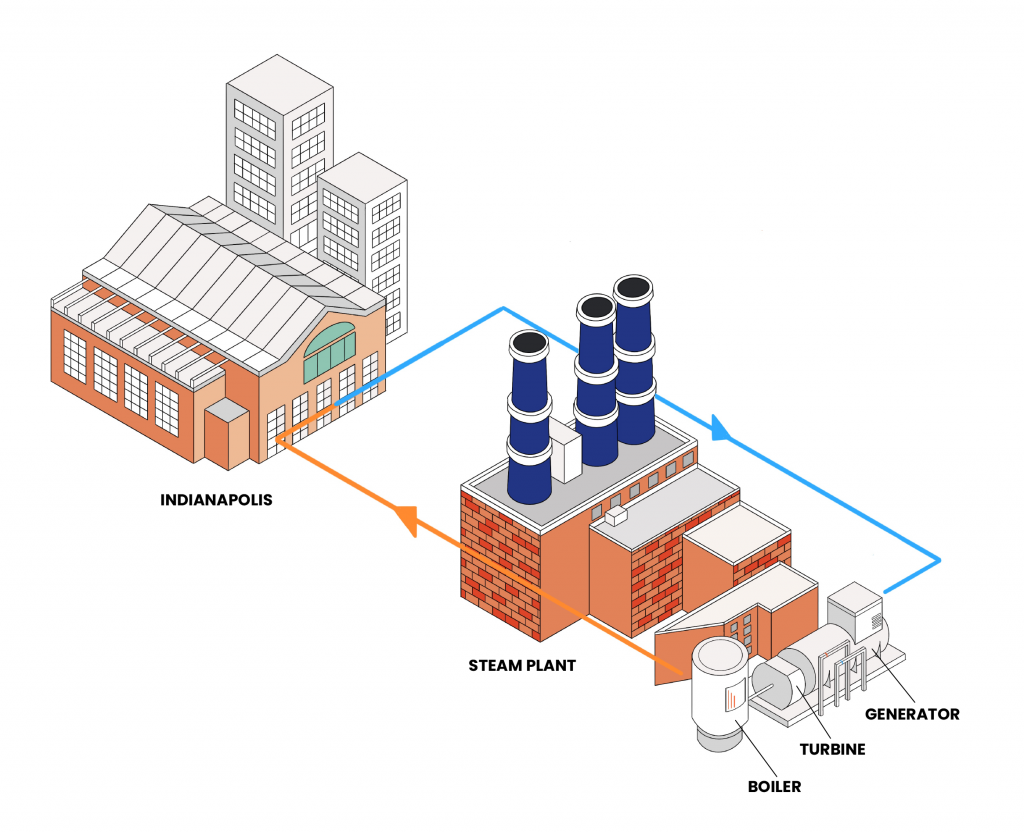
Above: A steam heat district generates heat at one central plant and distributes it through pipes to nearby homes, businesses, and industries. Natural gas fires a boiler and generates steam at 600 pounds of pressure per square inch. This steam powers two turbines that each generate 1.7 megawatts of electricity. This process reduces the pressure to 250 psi, appropriate for district steam service. Steam is carried to customers through insulated pipes. Customers can use steam-filled pipes to heat rooms or use a heat exchange to heat air or water. Some customers use the steam itself in processes like food preparation. A few customers, including Lucas Oil Stadium and the Indiana Convention Center, return cooled, condensed water at a temperature between 140-200°, where it is recycled through the steam system.
Atlas Sources
Locations of drinking water treatment facilities were sourced from Citizens Energy Group. Locations of waste water treatment facilities were sourced from the Environmental Protection Agency. Information about Eagle Creek Reservoir is from “On the Use of Landsat-5 TM Satellite for Assimilating Water Temperature Observations in 3D Hydrodynamic Model of Small Inland Reservoir in Midwestern US” (Babbar-Sebens, Li, Song, Xie. 2013). Information about Morse and Geist Reservoirs is from “Bathymetric Surveys of Morse and Geist Reservoirs in Central Indiana Made with Acoustic Doppler Current Profiler and Global Positioning System Technology, 1996” (Wilson, Morlock, Baker. 1997). Information about Citizens Reservoir is from Citizens Energy Group. Water consumption trends are sourced from the U.S. Geological Survey’s “Estimated Use of Water in the United States”.
Power plant locations are from the U.S. Energy Information Administration. Power plant production capacity and fuel type is from Indianapolis Power and Light, while greenhouse gas emissions are from the U.S. Environmental Protection Agency’s Greenhouse Gas Reporting Program. The combined cycle diagram is based on information from Indianapolis Power and Light. Energy mix data is from Indianapolis Power and Light and the U.S. Energy Information Administration. Pipeline locations are from Indiana Map, and information about use, storage, and transport of natural gas is from the U.S. Energy Information Administration.
Additional Information
Read these Encyclopedia of Indianapolis Entries for more information.