Population
This map shows population growth since 2010 in each census tract. Population is growing fastest in the northern and southern suburbs, but Downtown and the Northeast side are also growing fast.
Population Growth
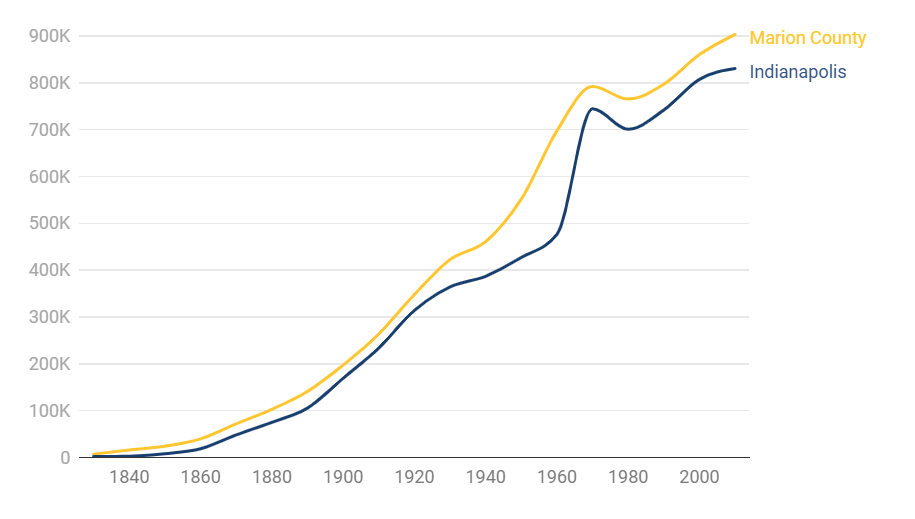
Indianapolis grew exponentially until the 1930s. The Great Depression and World War II slowed growth. Suburbanization caused most growth to take place outside the city limits, so Marion County’s population grew more quickly than Indianapolis.
In 1970, Unigov combined city and county governments and expanded the city limits to include most of Marion County. A population decline in the 1970s has been followed by steady growth in the decades since. Marion County has a larger population than Indianapolis because several cities are excluded from Unigov, including Beech Grove, Speedway, and Lawrence.
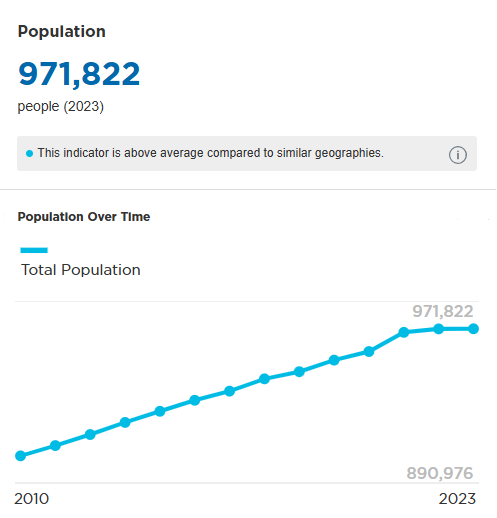
The estimated population of Marion County now approaches one million residents, fueled by growth downtown, in Decatur and Franklin Townships, and on the Northeast Side.
Marion County Population Since 2010
Population growth is driven by births, not migration
In the 2000s net migration was negative. People moving away outnumbered people moving to the city. This slowed the growth of the city. Since 2011 net migration has increased. This is due to increase international migration. Net domestic migration is still negative. Much of this domestic outmigration is caused by residents moving to suburban counties. Marion County’s population growth has come mostly from natural increase as births outnumber deaths about 2-to-1.

Suburbanization
Center Township, once home to most Marion County residents, is now only a fraction of the county population.
Proportion of Marion County population by township.
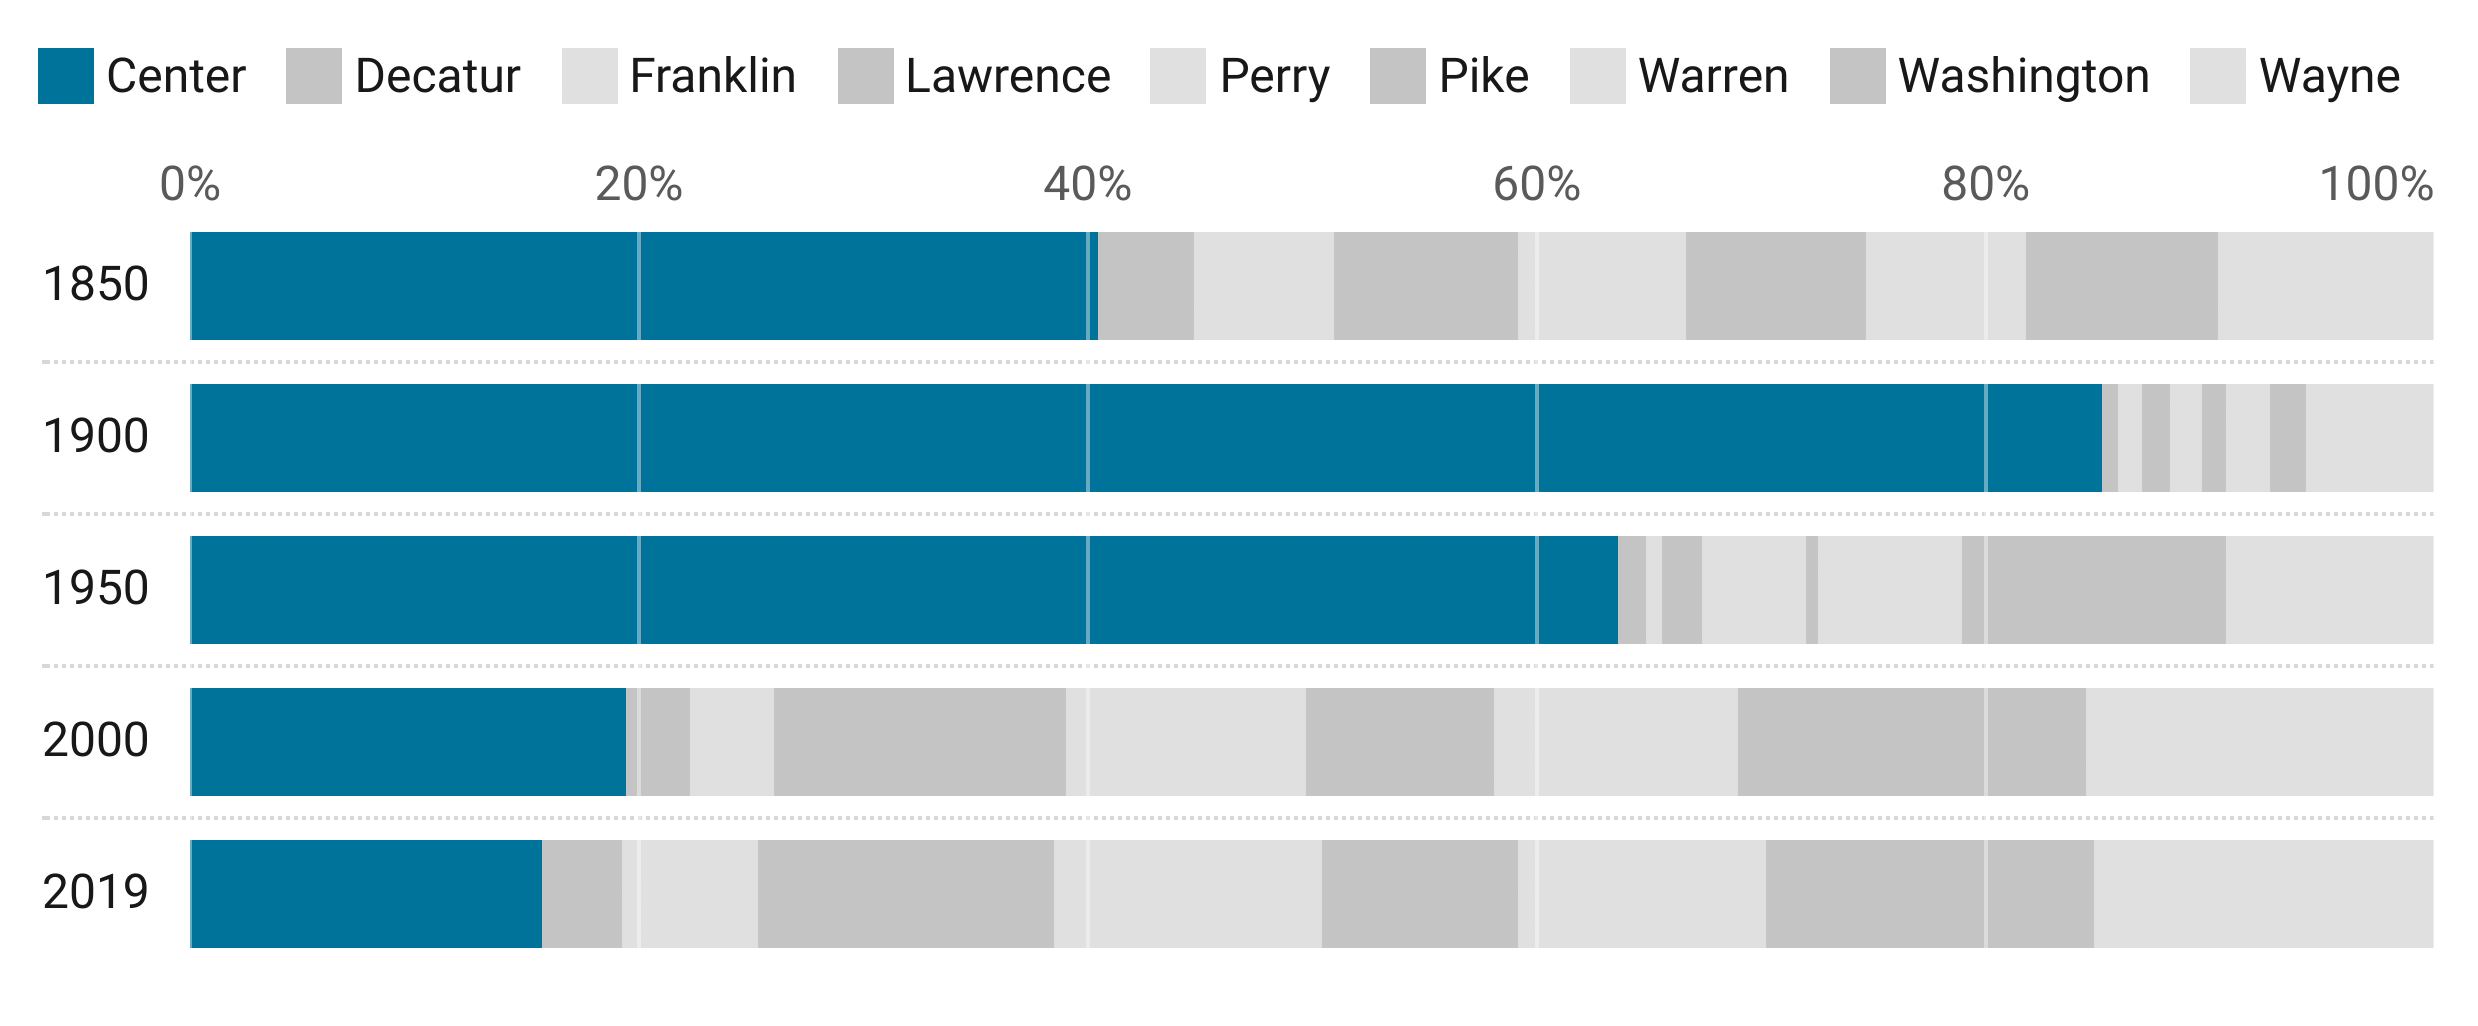
In the early decades of suburbanization, households moved from the center city to outer areas within Marion County. These shifts are evident in the population of Marion County townships.
In 1950, 64% of Marion County residents lived in Center Township. After population loss in Center Township and new development in outlying townships, less than one-in-five Marion County residents lived in Center Township in 2019.
Suburbanization led to the rapid growth of outlying counties since 1970.
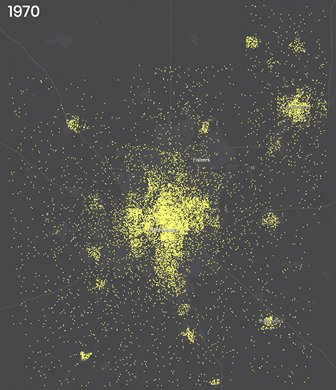
Each dot = 100 residents
Since the middle of the 20th century, population has grown quickly in places outside Indianapolis’ original city limits.
In 1970, most population is still located within the Indianapolis city limits. Outlying towns like Noblesville, Brownsburg, and Avon are visible as distinct population centers.
In the ensuing decades, these towns are absorbed into the larger metropolitan population as rapid growth expands north, west, and south.
Demographics
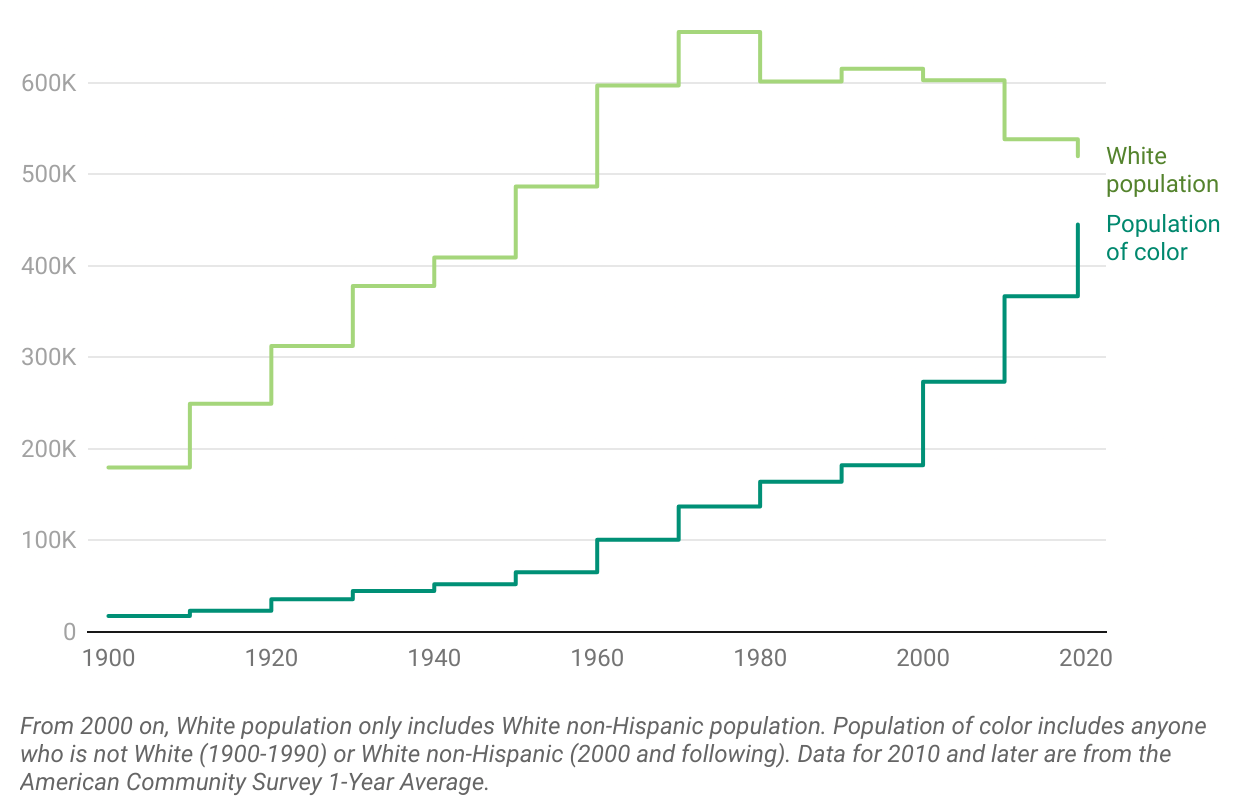
White population peaked in 1970 and has fallen since. As the population of color rose, these two demographic groups are nearly equal in number. People of color includes anyone who chooses a race other than white or choose and ethnicity of Hispanic or Latino in the census.
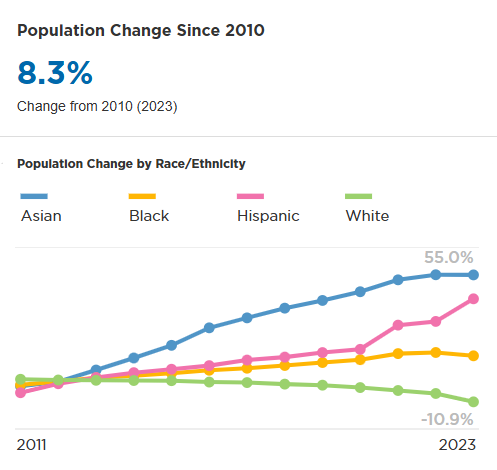
Growth rate by race and ethnicity
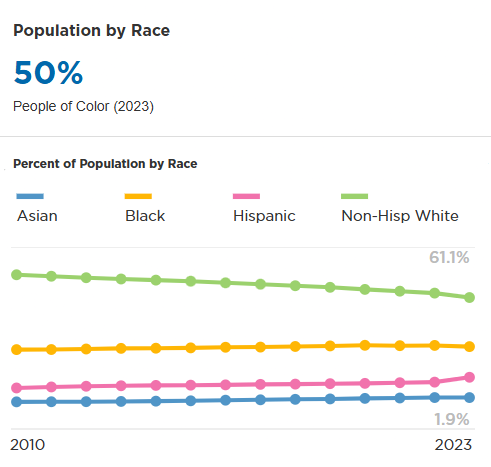
Population by race and ethnicity
International migration and higher birth rates among people of color have led to growth among Asian, Black, and Latino residents, while there are fewer White residents compared to 2010. The Asian population has grown very fast since 2010.
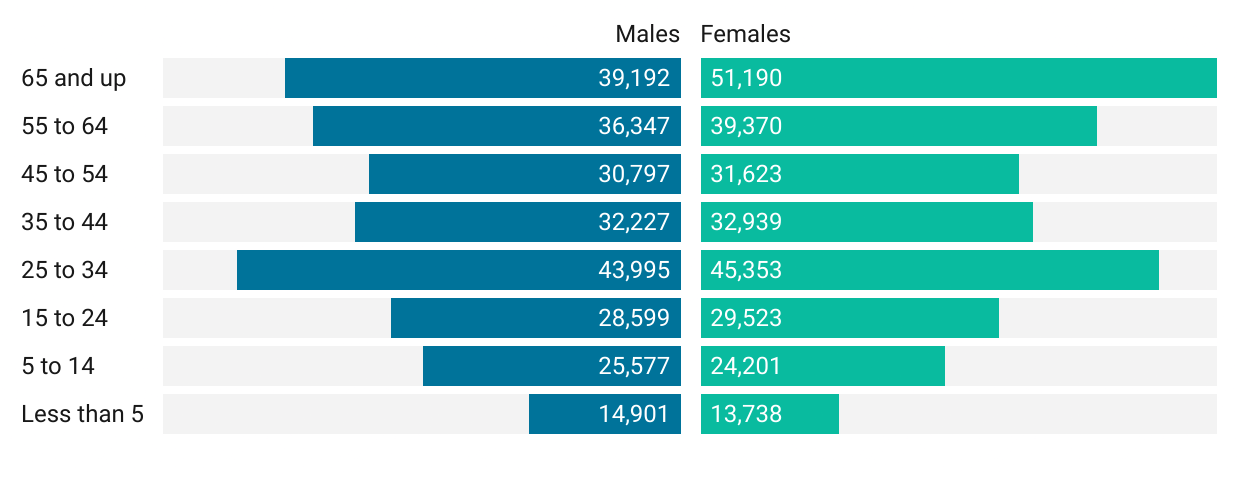
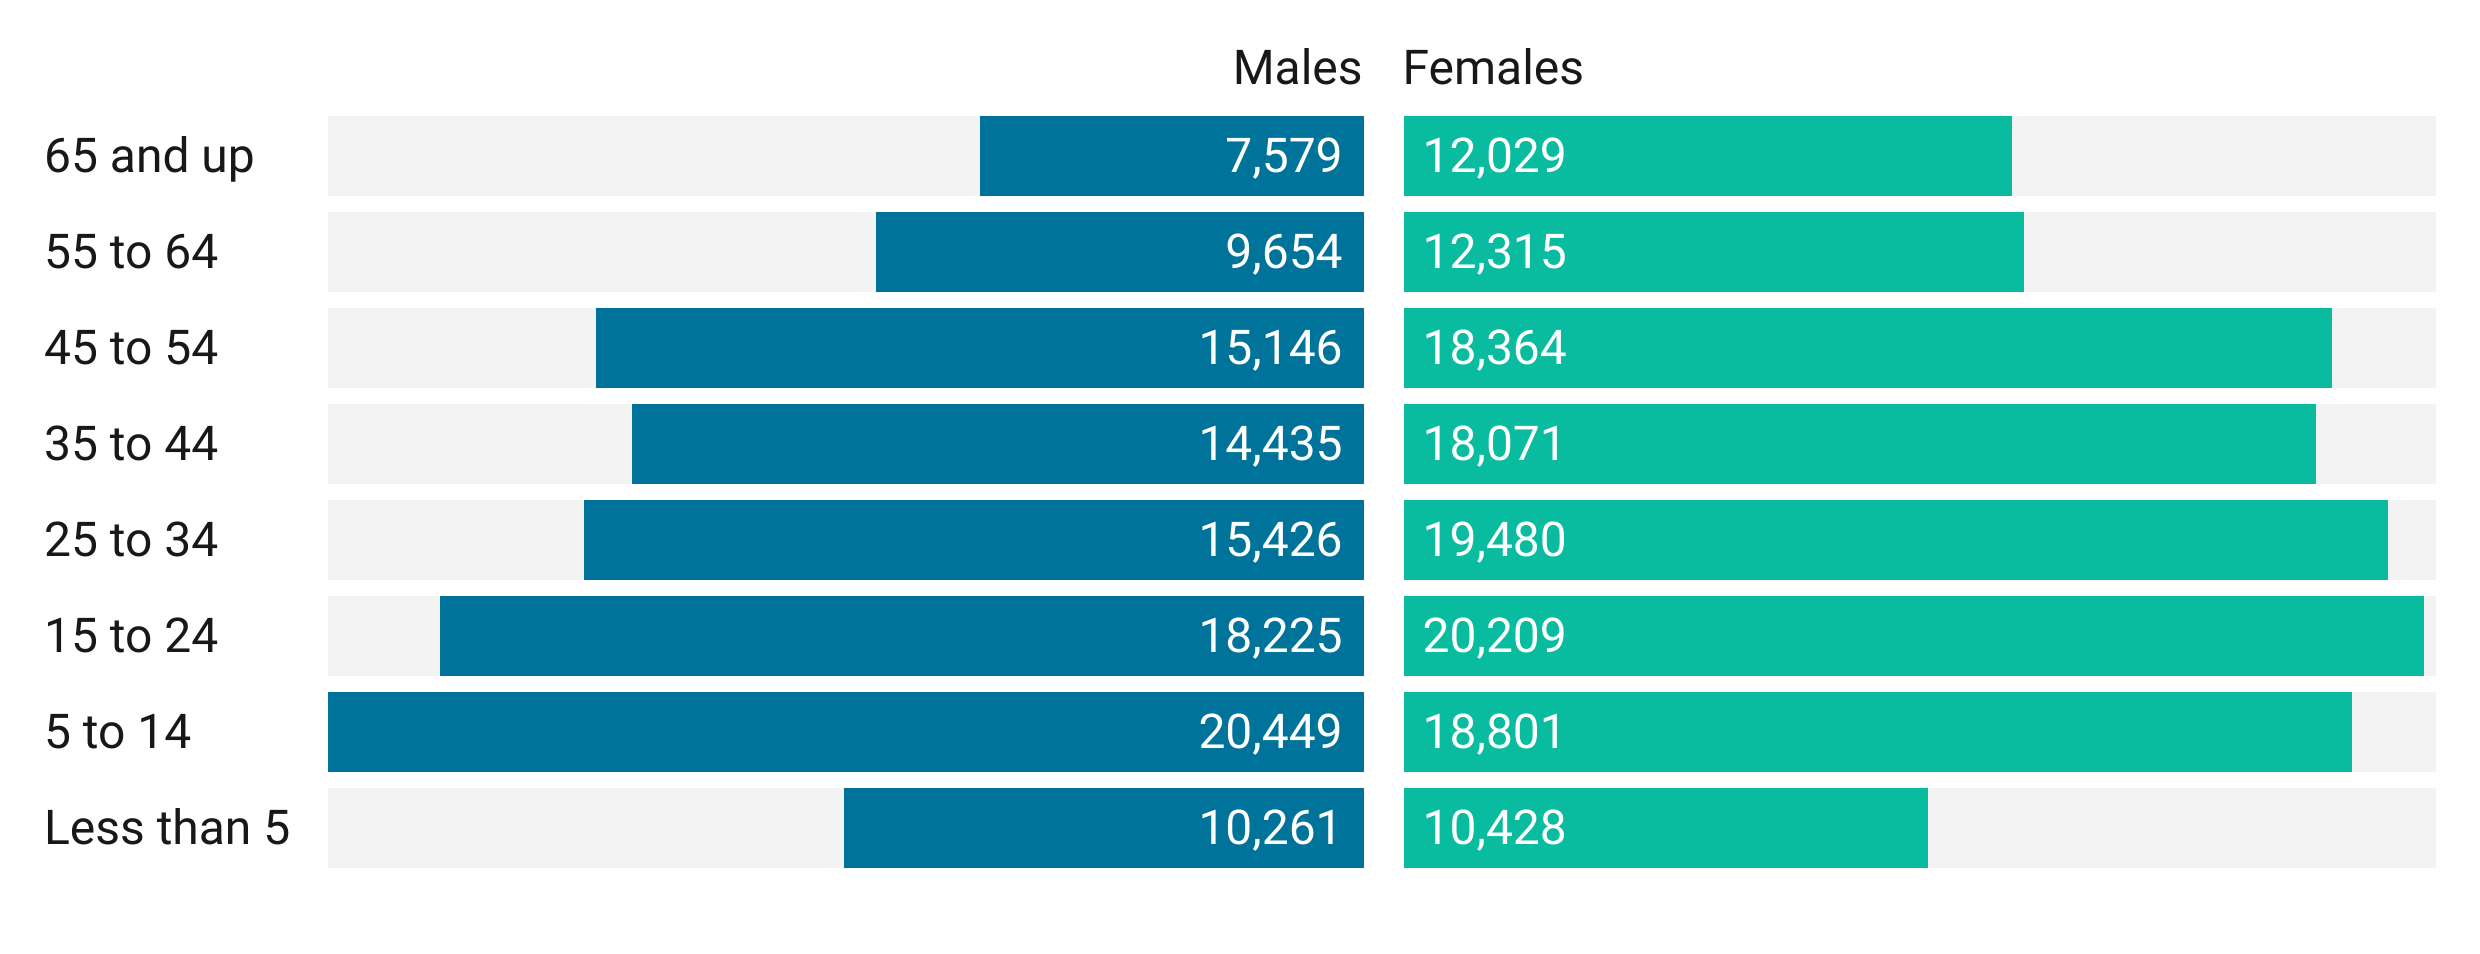
Population of Marion County by age and gender
1850

This is called an “expansive” age pyramid. There are many youth and few older adults. It reflects the pioneer nature of early Indianapolis: high fertility rates, low life-expectancy, and many working age adults. Men outnumber women in the prime working years, another indication of Indianapolis’ pioneer quality.
1900

By 1900, the age pyramid is similar to the United States overall. Longer life expectancy led to more older adults, and fertility rates declined. Men no longer outnumbered women at the prime working ages.
1970

The bulge in the bottom of this chart, ages 0-14, represents the baby boom generation, when, as World War II ended, fertility rates were very high. People were living longer, and one sixth of individuals are age 55 or older.
1990

Twenty years later, baby boomers were represented in the 25 to 34 year old category, though their proportion shrank as many left Marion County for the suburbs. Marion County’s older adult population continued to grow.
2019

As baby boomers aged and Generation Z was born, the age pyramid flattened into what is called a “stationary” age distribution. This indicates slow growth. It also means there are more dependent people (those too old or too young to work) who are supported by the income of working age adults.
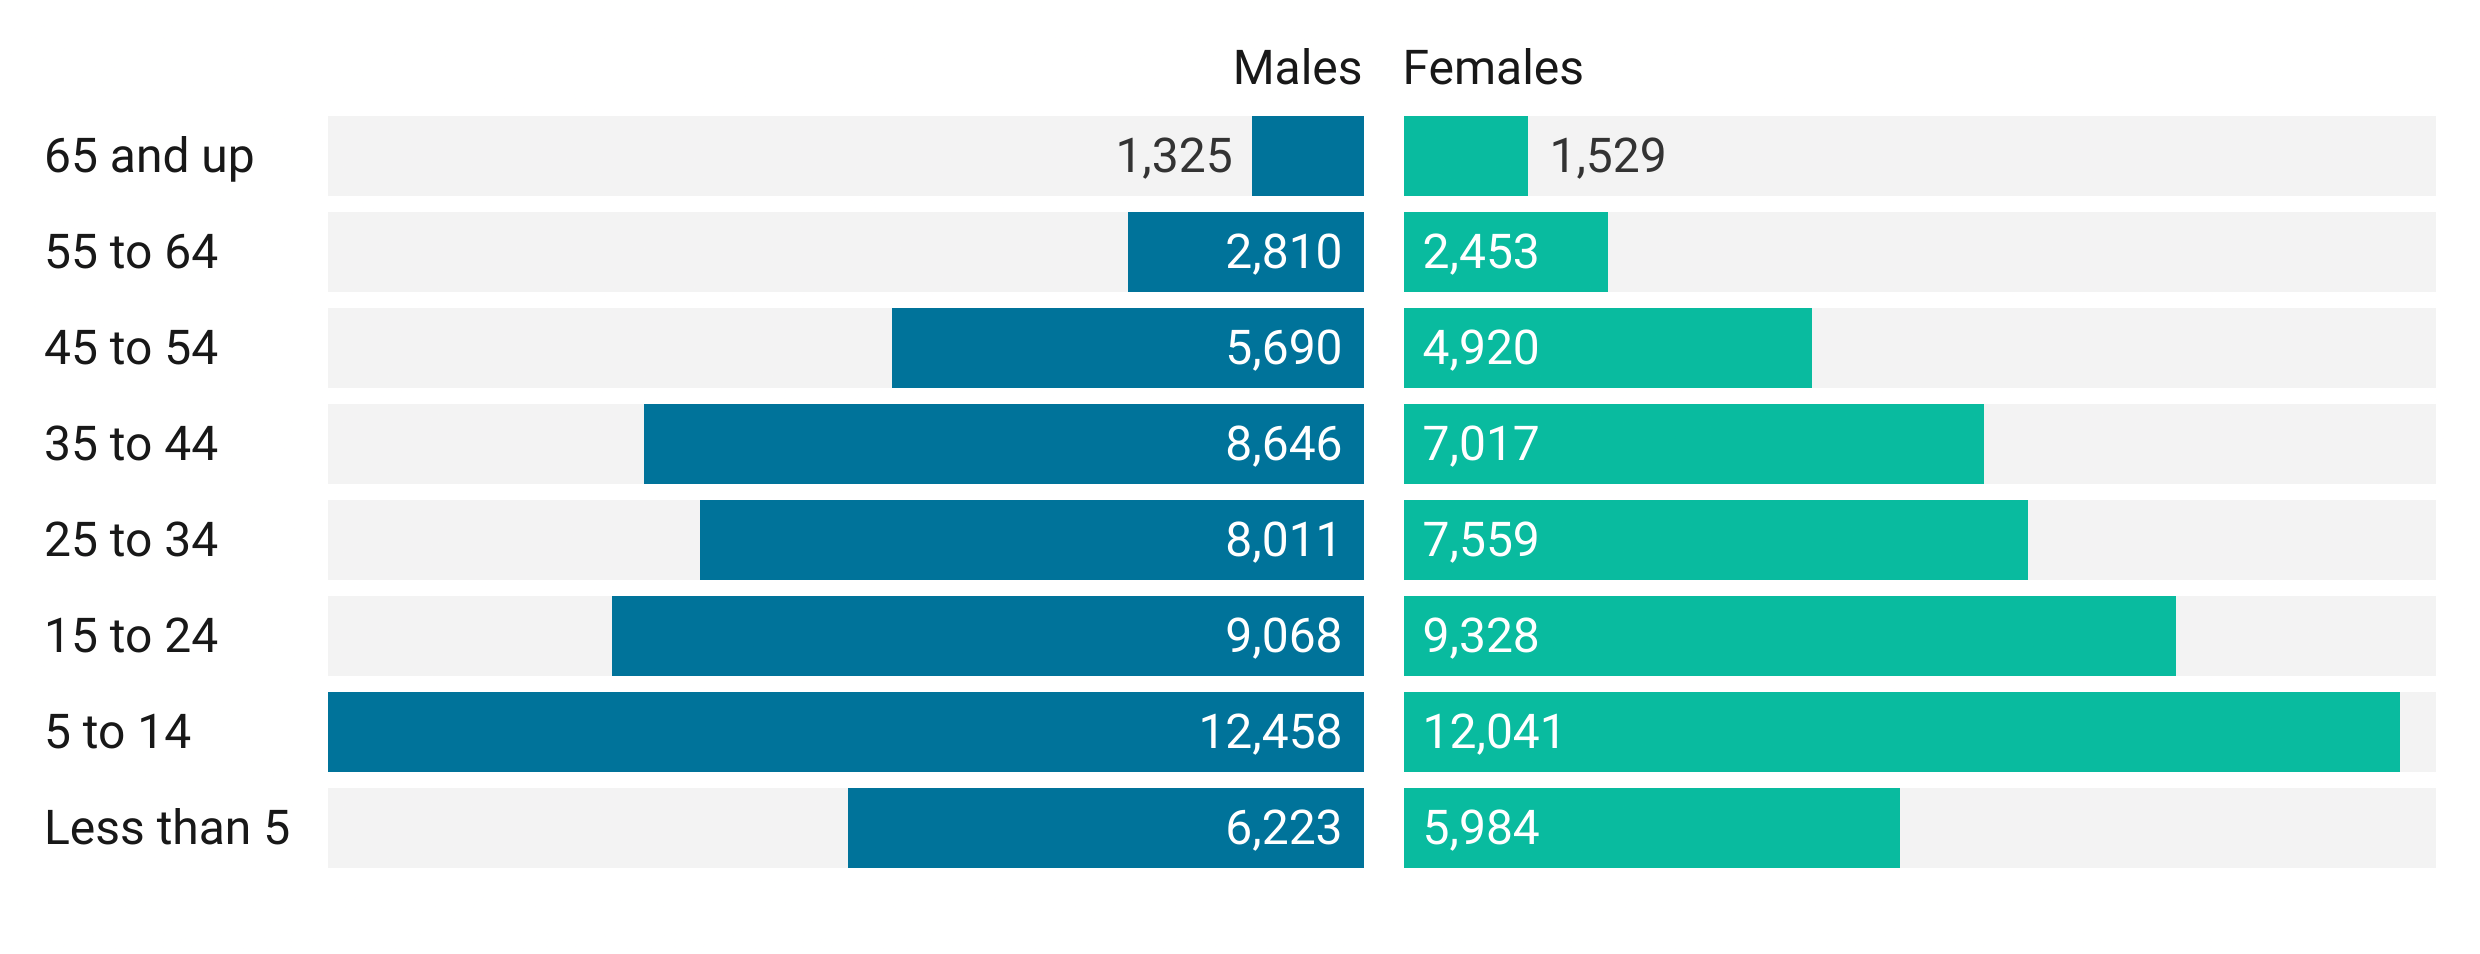
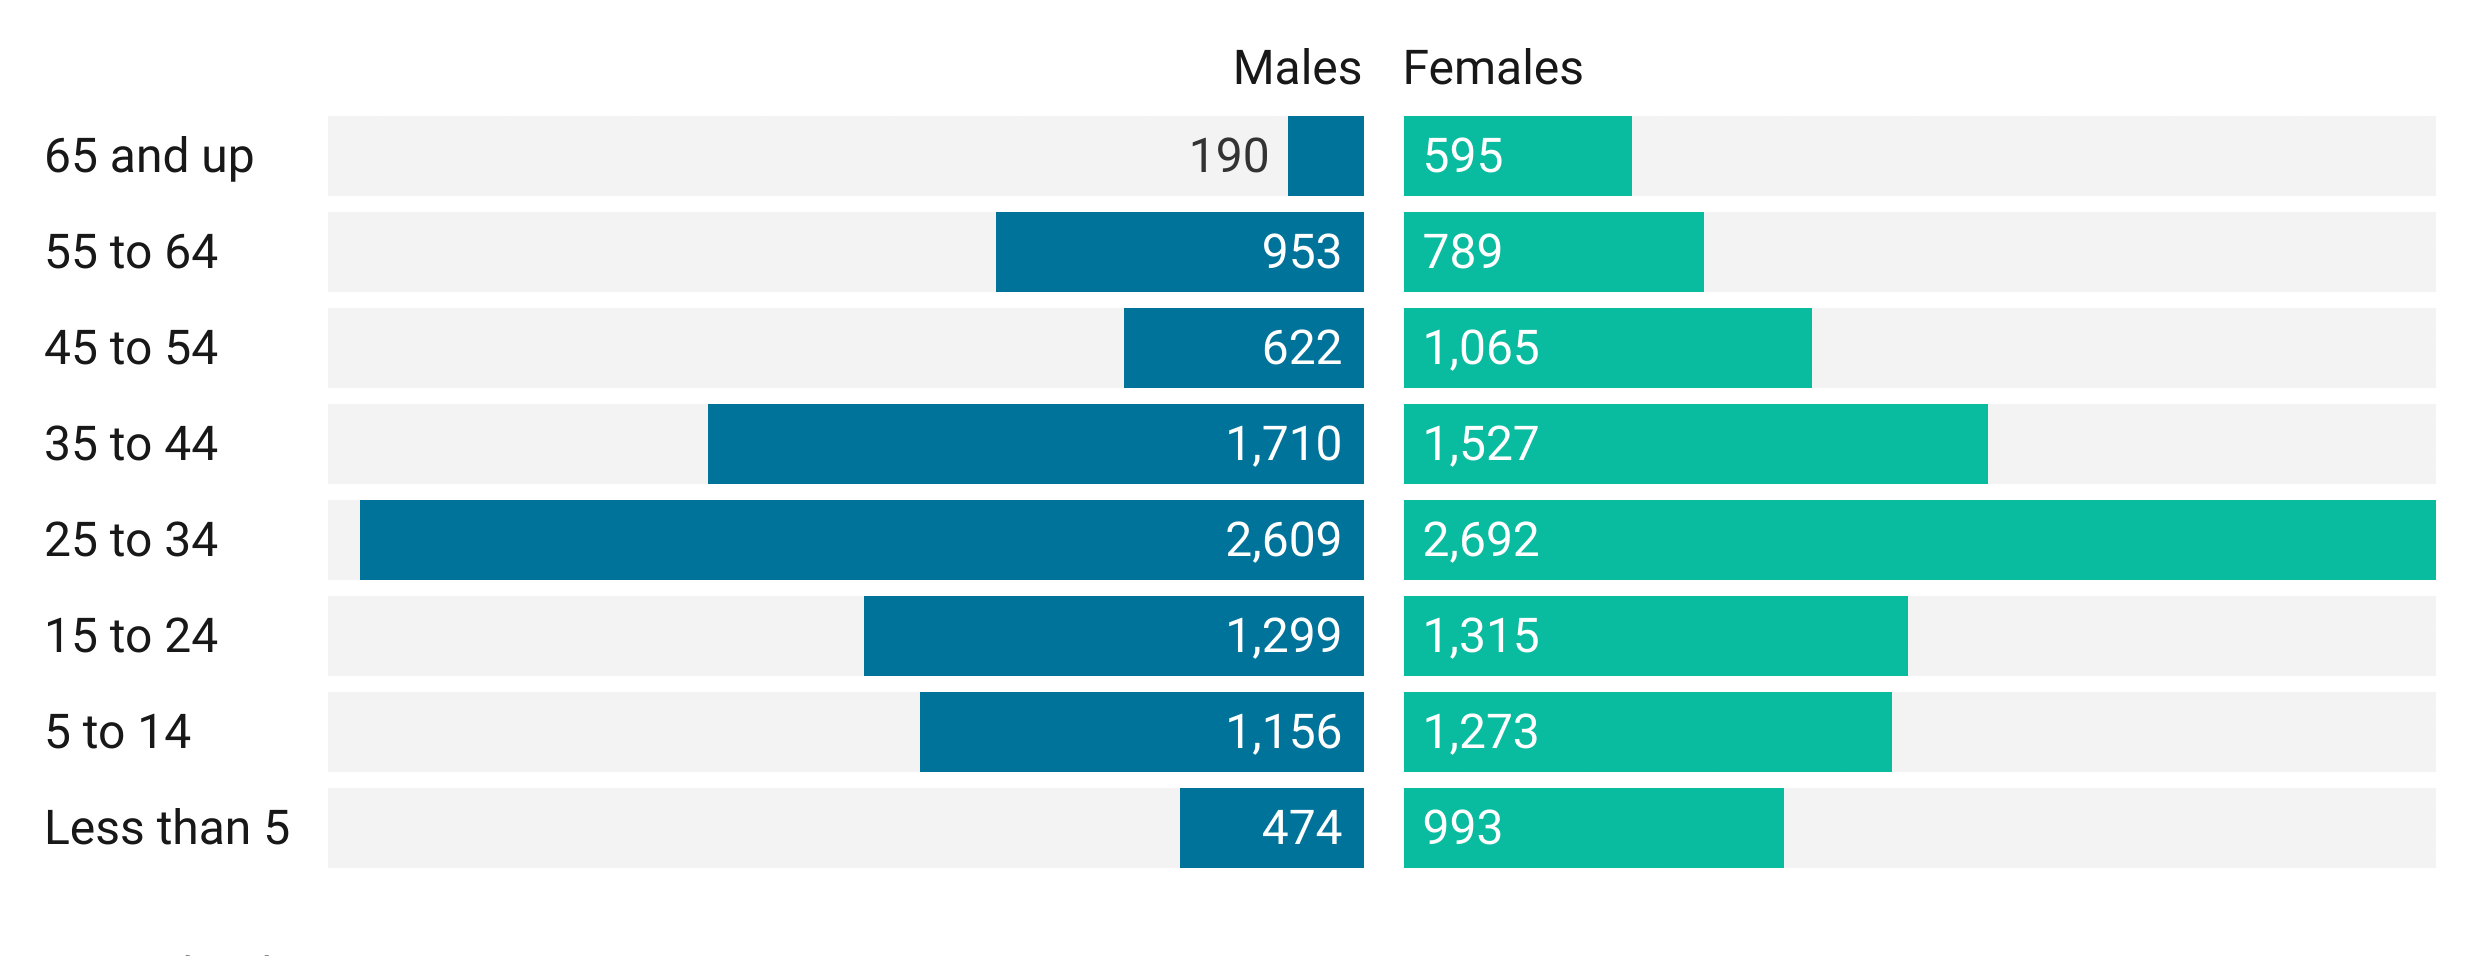
2019 Marion County age distribution by race
Age pyramids vary for each race. For White individuals, the age pyramid is inverted, indicating an aging and shrinking population. Black and Latino age distribution are truly “pyramid” shaped, indicating growing populations. There are relatively few older Latino and Asian individuals. Many of these residents are foreign born, and these populations will age as recent immigrants grow older.
White (Non-Hispanic/Latino)
Atlas Sources
Demographic information is from the U.S. Census and the American Community Survey. Components of growth, such as births, deaths, and migration, are from Indiana Business Research Center.
Additional Information
Read these Encyclopedia of Indianapolis Entries for more information.
- Indianapolis Metropolitan Area
- Demographic Profile
- All entries related to Demography and Ethnicity
- Migration Patterns
Other links: