Residential Segregation in Indianapolis
Who lives where — and why
By Jordan Ryan | 2022
Introduction
Where people live often reflects their race and not simply their income. The housing patterns of Indianapolis, like all American cities, is the result of racially discriminatory real estate practices from the 1920s and governmental policies that began in the 1930s. Even though they changed as a matter of law with passage of the federal Fair Housing Act of 1968, Indianapolis still mirrors the legacy of earlier racially based lending practices and deed restrictions, or covenants, that commonly became known as redlining. In the history of redlining, we can see how the past continues to shape the present.
Redlining
The stock market crash that began in October 1929, and the Great Depression that followed led to widespread unemployment—25 percent at its peak—and a nation that was ill-clothed, ill-housed, and ill-fed. After his inauguration as president in 1933, Franklin D. Roosevelt launched the New Deal, which involved massive government stimulus programs designed to put people to work and address the problems of poverty, inadequate housing, and relief.
A new agency, the Federal Housing Administration (FHA), together with the Home Owners Loan Corporation (HOLC), assumed responsibility for boosting the nation’s housing market. The HOLC, created in 1933, refinanced defaulting mortgages to prevent foreclosure. Congress created the FHA in 1934 to insure mortgages for private lenders. The legislation intended to make homeownership affordable, provide a new home mortgage system, and direct relief to households. The FHA set uniform national standards for housing construction and or real estate appraisals, with the federal government insuring the mortgages that followed, thereby giving confidence of payment to banks and builders.
One of the FHA’s policies was to classify geographic areas into one of three tiers based on an assessment of whether these areas were desirable or undesirable for mortgage loans and property insurance. The agency created “Area Description Forms,” which provided the basis for drawing HOLC maps that reflected an evaluation of each district outlined in them. Data collected in these forms included information on the terrain, inhabitants, buildings, property assessment values – both sales and rentals – and other comments.
In general, green areas graded A for “Best,” blue areas graded B for “Still Desirable,” devalued yellow and red areas graded C for “Definitely Declining,” and D for “Hazardous.” Numerous demographic, geographic, and economic factors affected neighborhood evaluations. Common reasons for lower FHA valuations included the age of housing stock and the percentage of people of color and immigrants in a neighborhood. Race, however, factored into area devaluation to a higher degree than the presence of foreign-born populations. The emergence of zoning in 1922 also heavily influenced district classification. Such factors as proximity to flood plains or railroads, connected to zoning and its aim to direct land use and development, contributed to valuation.
Not surprisingly given the overt racial discrimination of the 1930s, areas where people of color lived received the least desirable ratings, with Black neighborhoods almost uniformly assigned grades of C and D (“Definitely Declining” and “Hazardous”). Residents in areas shaded in red would not qualify for mortgage lending. This practice gave rise to the term “redlining,” which now refers not only to the racist practice but also to the consequences that we still see today.
The Practice of Redlining in Indianapolis
Underwriters’ Manual
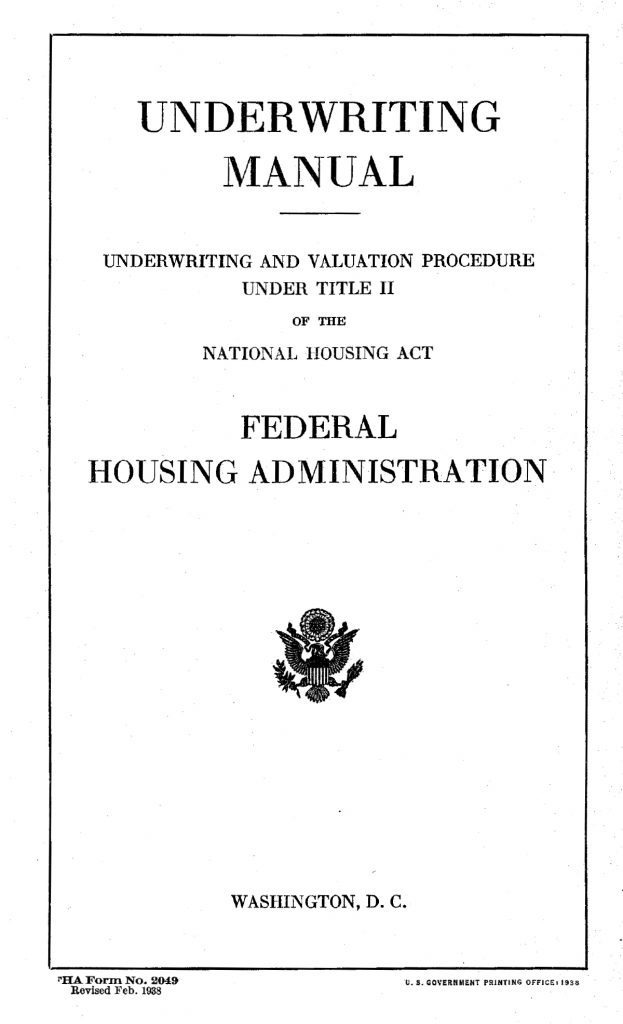
The Federal Housing Administration’s manual, Underwriting and Valuation Procedure Under Title II of the National Housing Act, detailed the agency’s evaluation procedures. The evaluation determined if mortgages were eligible for government-sponsored FHA insurance that protected lenders. The manual begins with standard components related to property eligibility including such characteristics as lot size and dimensions; if the street is paved; building age; number of family units, rooms, and baths; source of water supply; and method of sewage disposal.
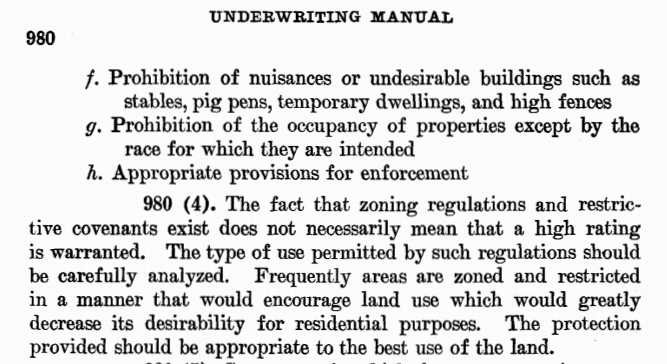
Zoning ordinances, first enacted by the Indianapolis Common Council in 1922, also provided a metric for evaluators. City planners used zoning laws, the earliest of which were passed in New York City in 1916, as a strategy for land use and development. Zoning aimed to protect neighborhoods from “undesirable elements” and to avoid creation of “blighted areas.”
Real estate convenants too influenced the practice of redlining, at times directly. Beginning in the 1920s, neighborhoods began adopting covenants that restricted multi-family housing and industrial development. These convenants preserved real estate valuations by promoting the ideas of neighborhood “stability” and “permanence” to prospective home buyers. Many convenants included language that prevented racial integration.
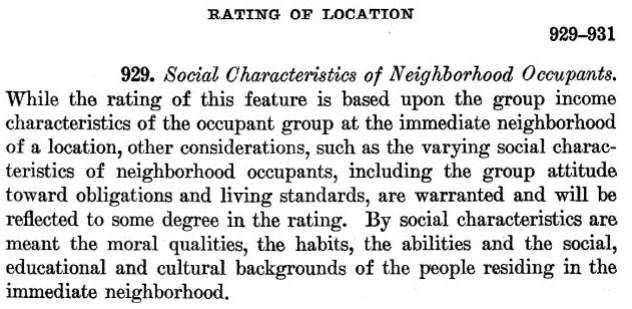
The underwriter’s manual affirmed the policy of implementing restrictive real estate covenants. It also indicated that neighborhoods should be racially and economically homogenous. It used coded language such as “social characteristics” and “moral qualities, the habits, the abilities, and social education, and cultural backgrounds” of neighborhood residents, which were subjective assessments and reinforced racial and economic stereotypes. The manual connected neighborhood demographic change, particularly involving the movement of non-whites into a formerly white-majority neighborhood, with lower property values. It also was inherently sexist. It refers to all buyers, sellers, etc., with only the pronoun “he.”
Area Description Forms
FHA Surveyors used the underwriters’ manual as their guide for completing the Area Description Forms. These forms prompted surveyors to describe the terrain, inhabitants, buildings, and property assessment values (both sales and rentals), along with other comments, according to the manual’s instructions. The FHA evaluated information compiled on the Area Description Forms and gave each district a “Security Grade” following the manual’s specifications. The HOLC then drew grades from the forms to draw its maps.
Click on each highlighted area or use the arrows at the bottom of the map for more info:
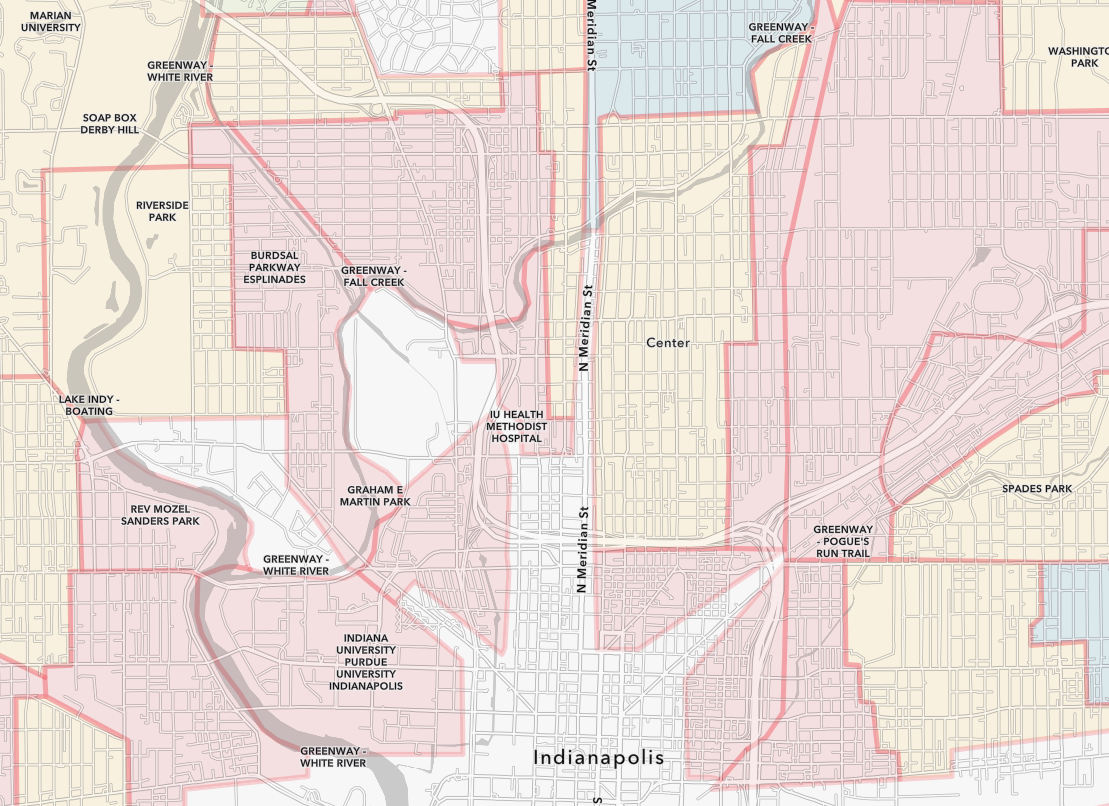
A redlined “Hazardous” area of downtown with Massachusetts Avenue splitting it in the middle, including the neighborhoods of St. Joseph, Lockerbie, and Chatham-Arch. Unfavorable influences noted included age, rooming houses, nearby factories, and “alleys occupied by negroes.”
A redlined “Hazardous” area located predominantly in the Ransom Place neighborhood. Favorable influences recorded included “none” and detrimental influences were “Age. Almost solid negro. Industrial.”
The Highland Vicinity and Riverside areas were also redlined “Hazardous” but under “Favorable Influences” list “Portion is desirable residential neighborhood for better class negroes.”
On this image
-
Area D9 – Northeast Central Indianapolis A redlined “Hazardous” area of downtown with Massachusetts Avenue splitting it in the middle, including the neighborhoods of St. Joseph, Lockerbie, and Chatham-Arch. Unfavorable influences noted included age, rooming houses, nearby factories, and “alleys occupied by negroes.”
-
Area D25 – Old Northwest Central Indianapolis A redlined “Hazardous” area located predominantly in the Ransom Place neighborhood. Favorable influences recorded included “none” and detrimental influences were “Age. Almost solid negro. Industrial.”
-
Area D27 – North Indianapolis The Highland Vicinity and Riverside areas were also redlined “Hazardous” but under “Favorable Influences” list “Portion is desirable residential neighborhood for better class negroes.”
The 73 districts laid out for Indianapolis yields some interesting findings.
Race: All Black household majority districts appeared in the D “Hazardous” category. The majority Black districts were in the near northwest section of the city, the southern part of the Riverside area, the Kennedy-King area, and the former Old Southside/Concord/Babe Denny. The Area Description forms noted two Black households in only one B “Still Desirable” category, B7 on the Near Eastside.
Immigrants/Foreign-Born: Immigrant/foreign-born populations identified in Area Description forms typically accounted for 0.5 to 4 percent of residents. The forms, however, reveal no obvious ways in which surveyors stratified various immigrant groups when they graded neighborhoods. The Area Description Forms identified the presence of German residents in A “Best” category districts. Immigrants, including German, Italian, and Jewish were noted in the B “Still Desirable” category. Italians appeared in neighborhoods graded B, C, and D in the forms. Jews were included along with Germans and Italians in an immigrant/foreign-born population that together comprised 2 percent of the population of a section graded B. Further investigation of the foreign-born category can be carried out through further examination and analysis of the Area Description Forms that are embedded in the interactive map in the “What is the history of your neighborhood?” section.
Housing Age: Neighborhoods that were 40 years or older (homes built before 1890) were almost always classified in the D “Hazardous” category. Evaluation standards appeared to correlate quality with housing age.
Housing Typologies: Single-family home majority districts received higher ratings, A “Best” or B “Still Desirable,” whereas areas with large numbers of multi-family units or apartments were C “Definitely Declining” and D “Hazardous,” suggesting an economic bias against rentals and multi-family and attached housing types.
Proximity: The significance of proximity to certain types of buildings and features, like railroads, churches, schools, and factories, varied. The economic status of inhabitants apparently predisposed surveyors to make certain judgments. For example, in areas where high numbers of white laborers lived, evaluators often determined that, by providing easy access to work, being close to railroads and industry was a “favorable influence.” For white affluent areas, proximity to railroad tracks and factories proved detrimental, leading to lower evaluations.
Restrictive Housing: Neighborhoods, developments, and subdivisions with racial covenants carried the designation “highly restrictive.”
Flooding: The FHA graded areas in the White River and Eagle Creek flood plains as least desirable because of possible flood damage to the buildings that existed in them. Early zoning classifications focused on this low-lying terrain, and, at this time, poorer residents, who could not get insurance, usually occupied any housing in these districts.
Results
This 1937 HOLC map shows the grading of each neighborhood in Indianapolis. Almost the entire core of the city was graded C or D, while only a handful of areas (on the north side and part of Irvington) were graded A. The areas colored white with hatch marks were ungraded because they were primarily commercial or industrial.
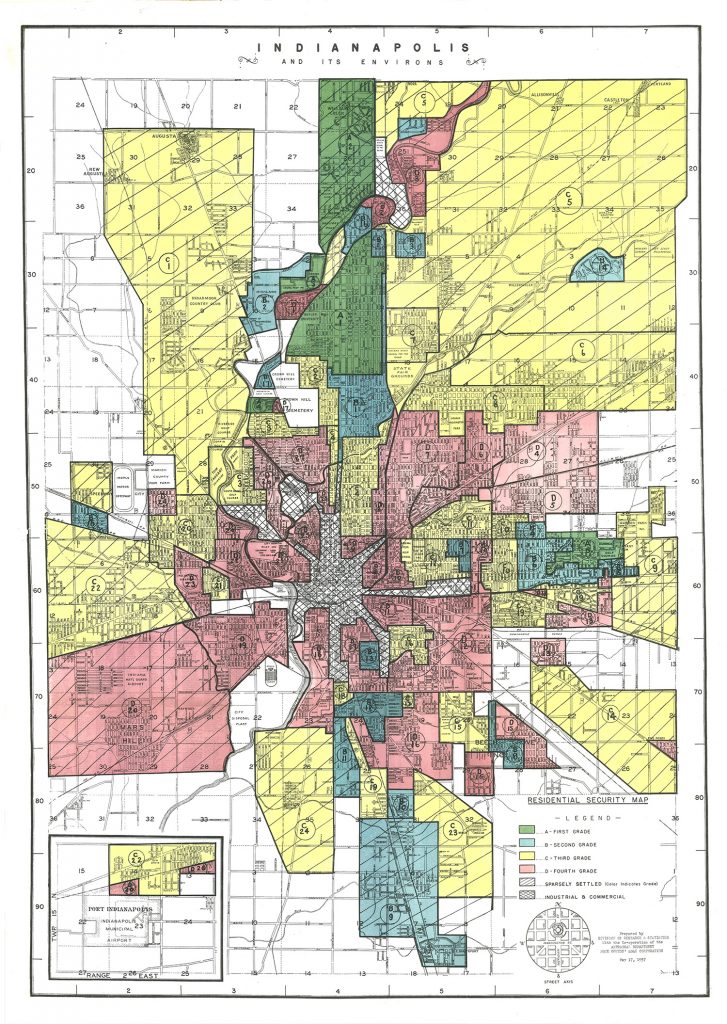
The map clearly reveals which areas of the city would be most attractive to white buyers, as well as where prospective buyers could obtain a mortgage. It served as a tool to keep neighborhoods racially segregated. Real estate interests used these maps to promote desirable properties to whites. Bankers refused to create mortgages for homes that were not in desirable areas. Purchasers in areas graded D (and often C) had to buy homes with cash or on contract, an often-shady practice in which the would-be owner made monthly payments to the seller but had no legal claim, or title, to the property until the last installment.
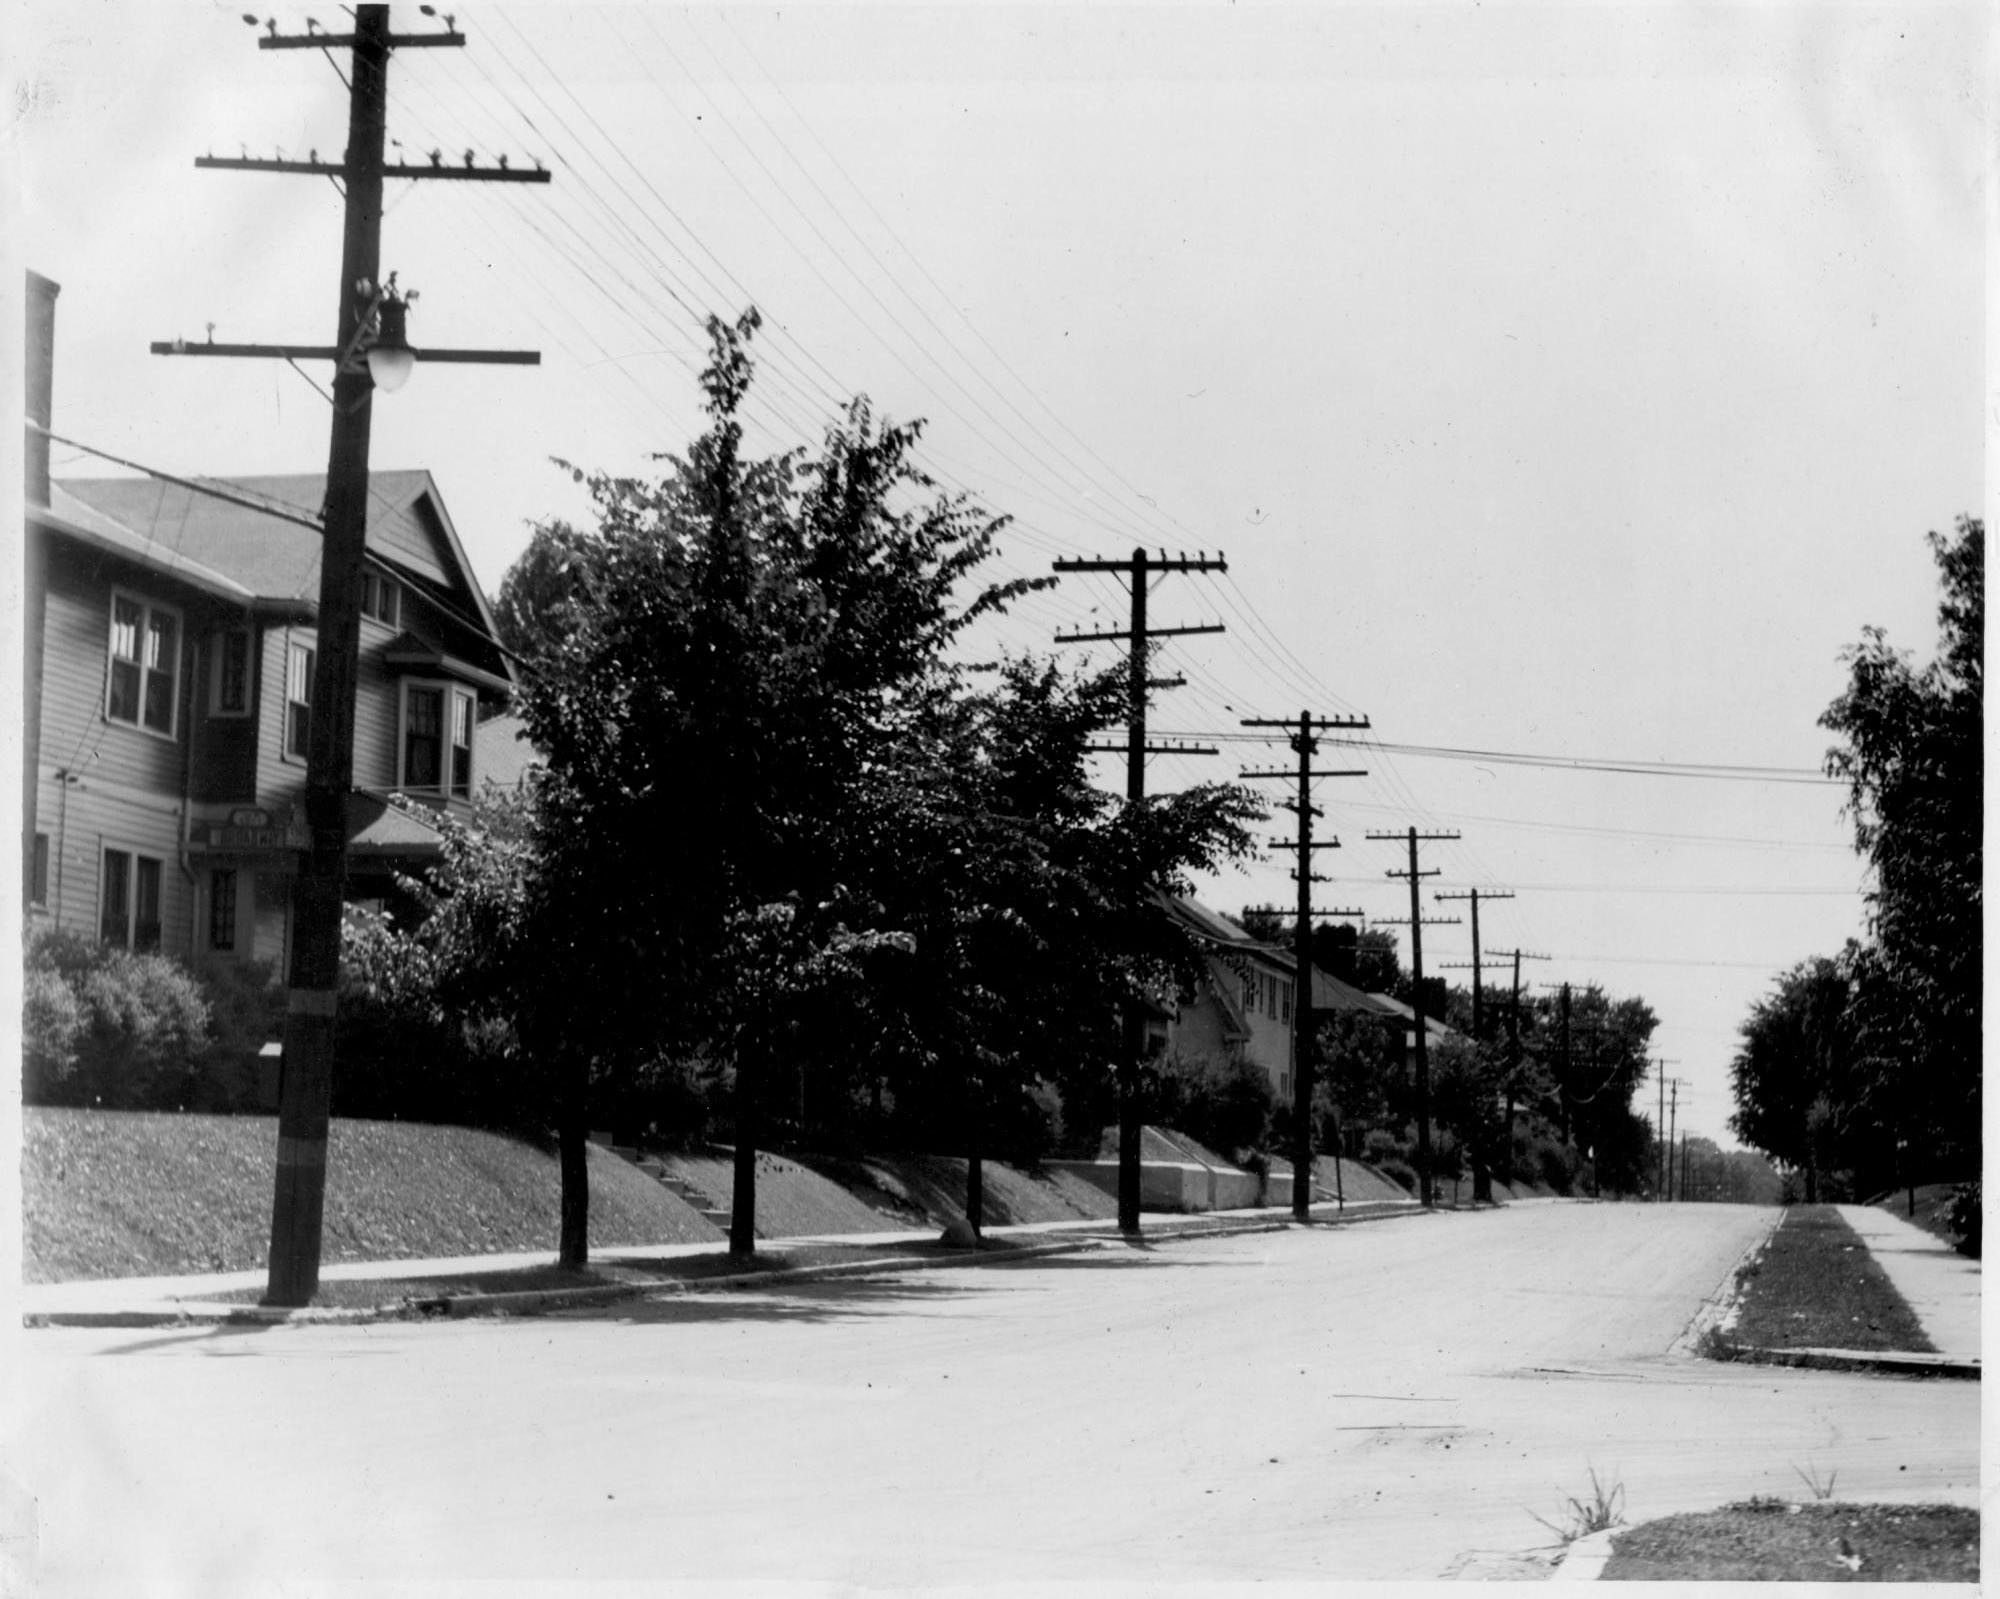
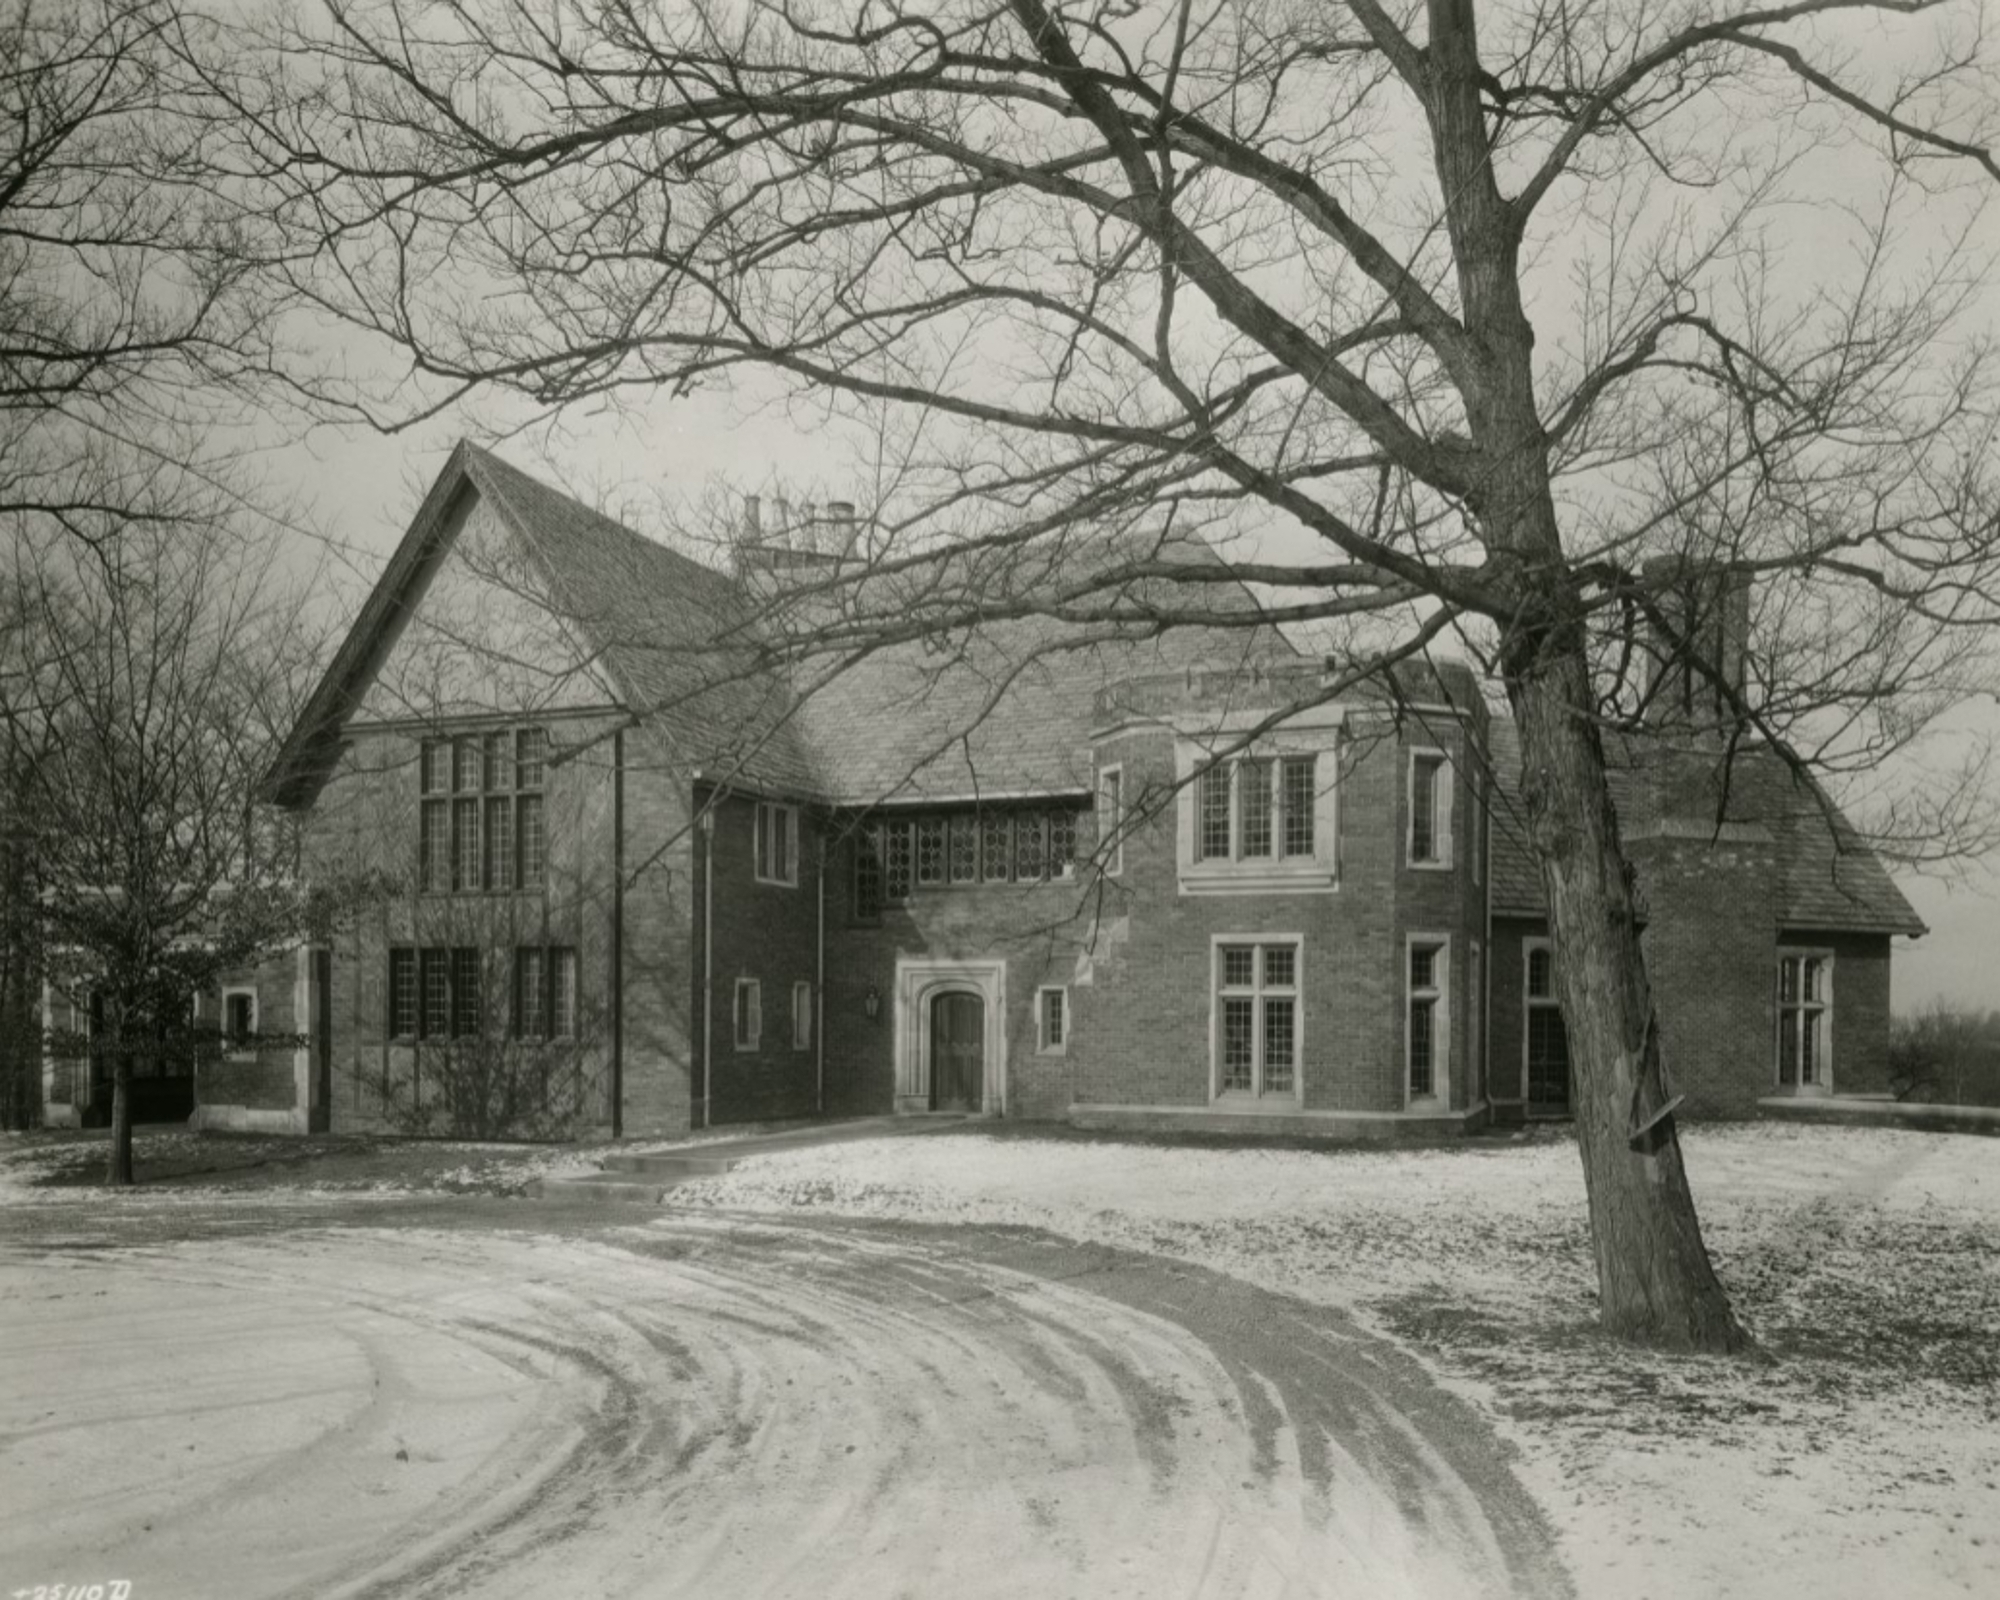
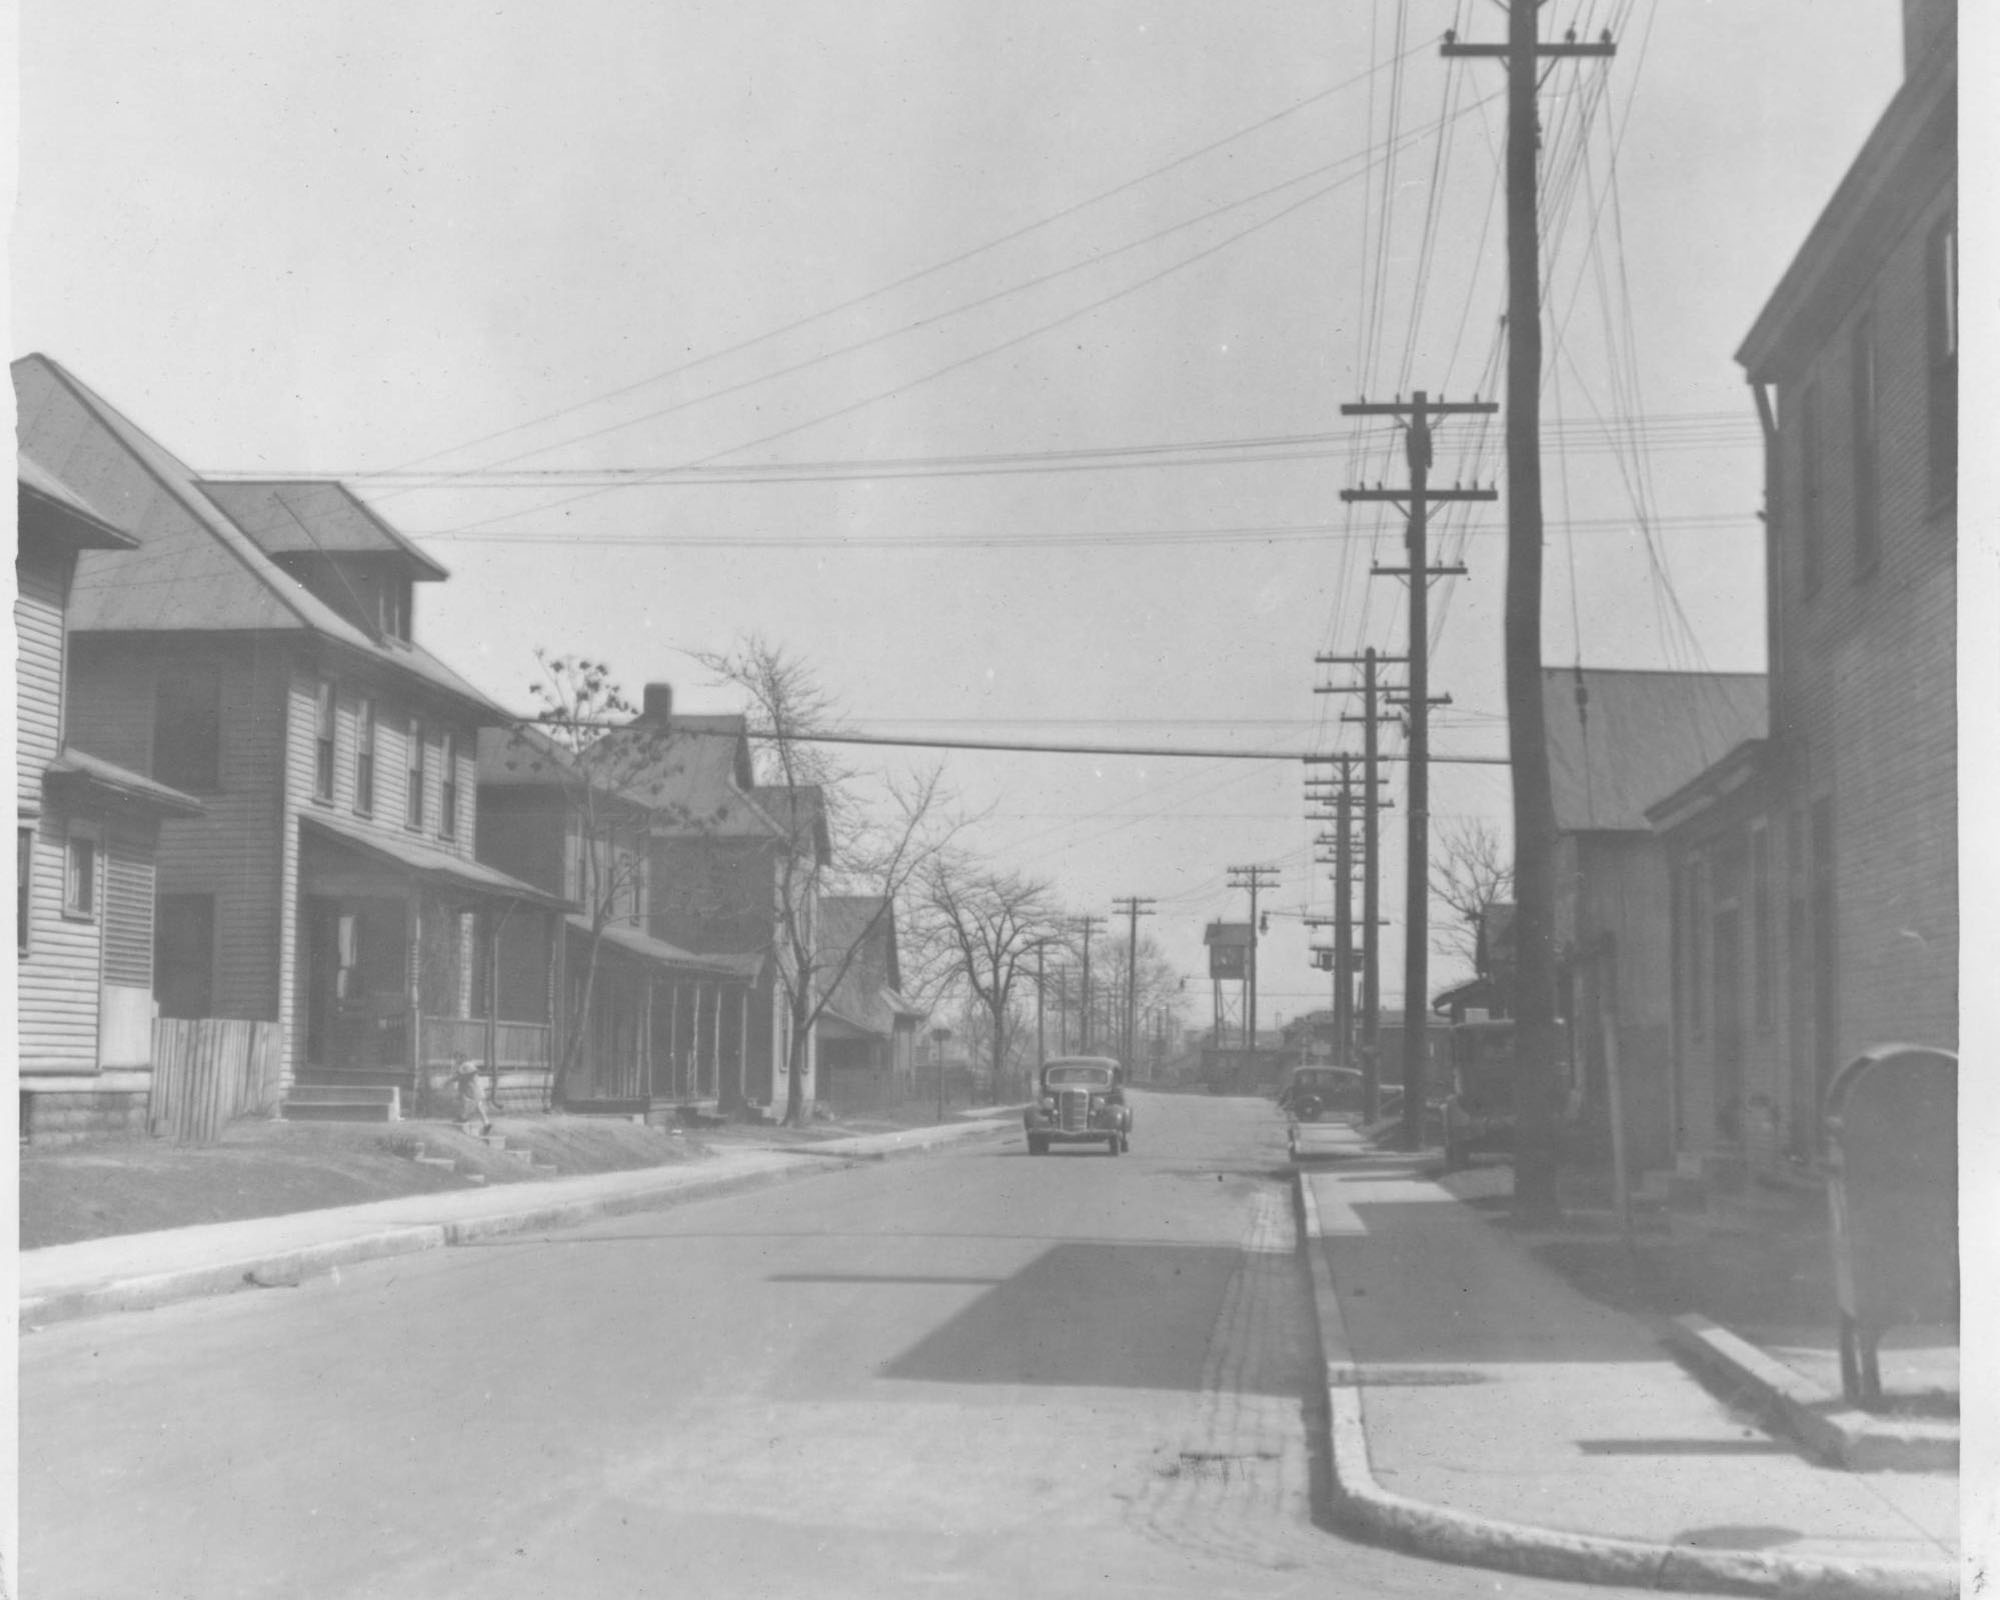
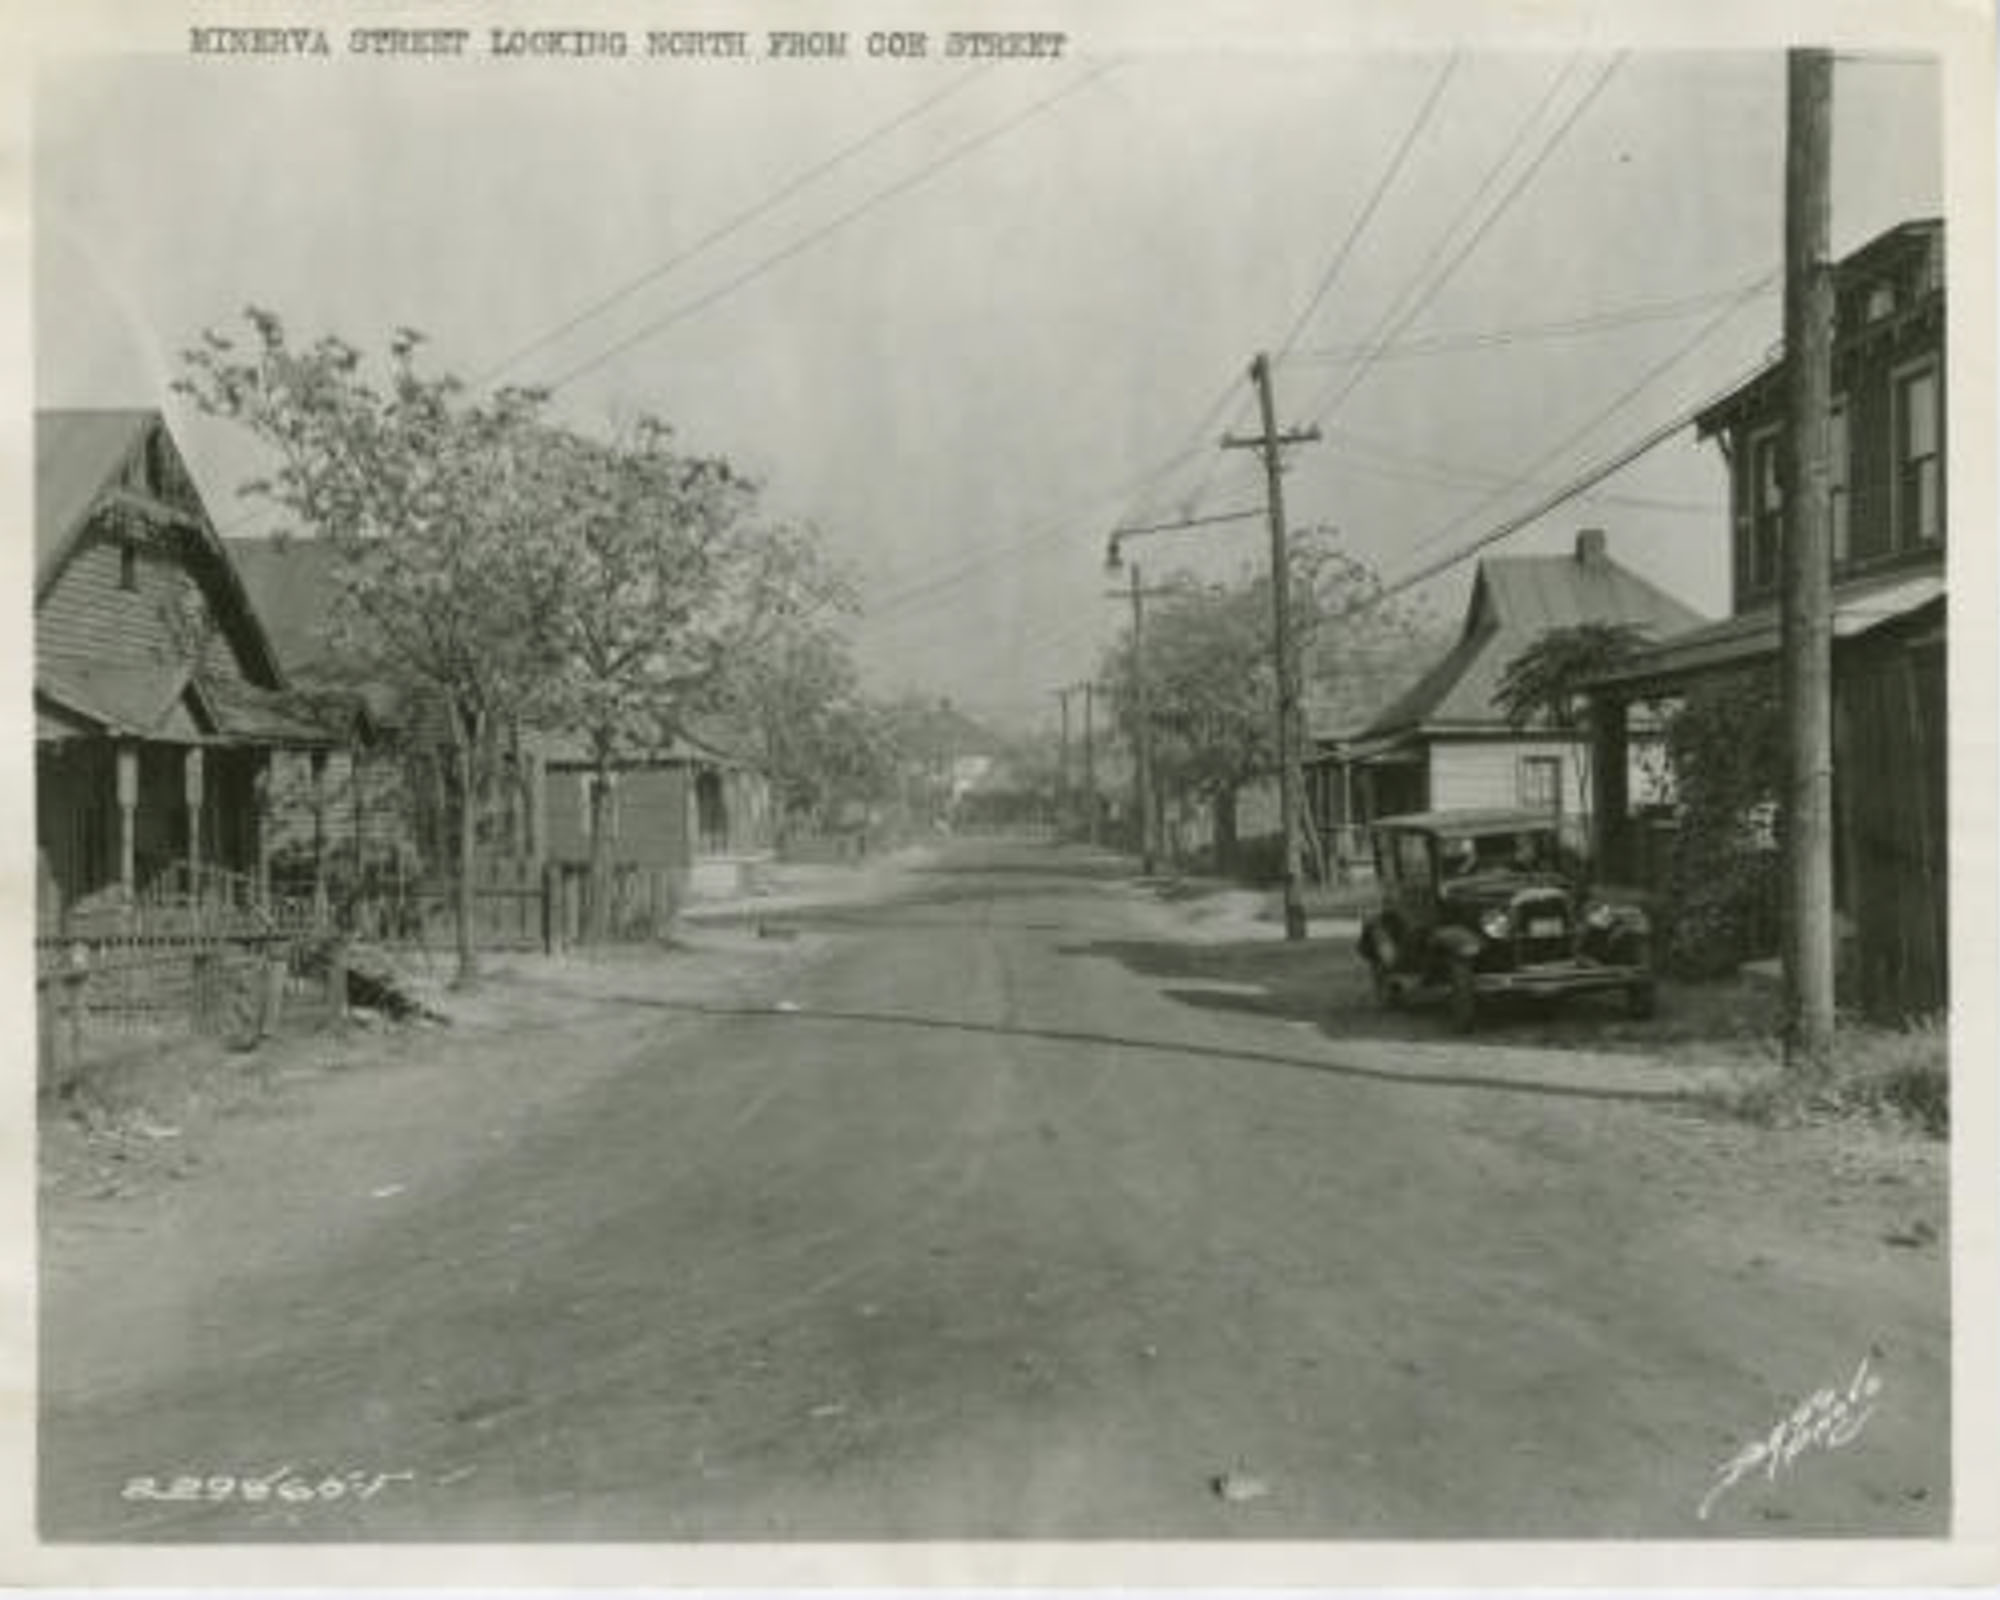
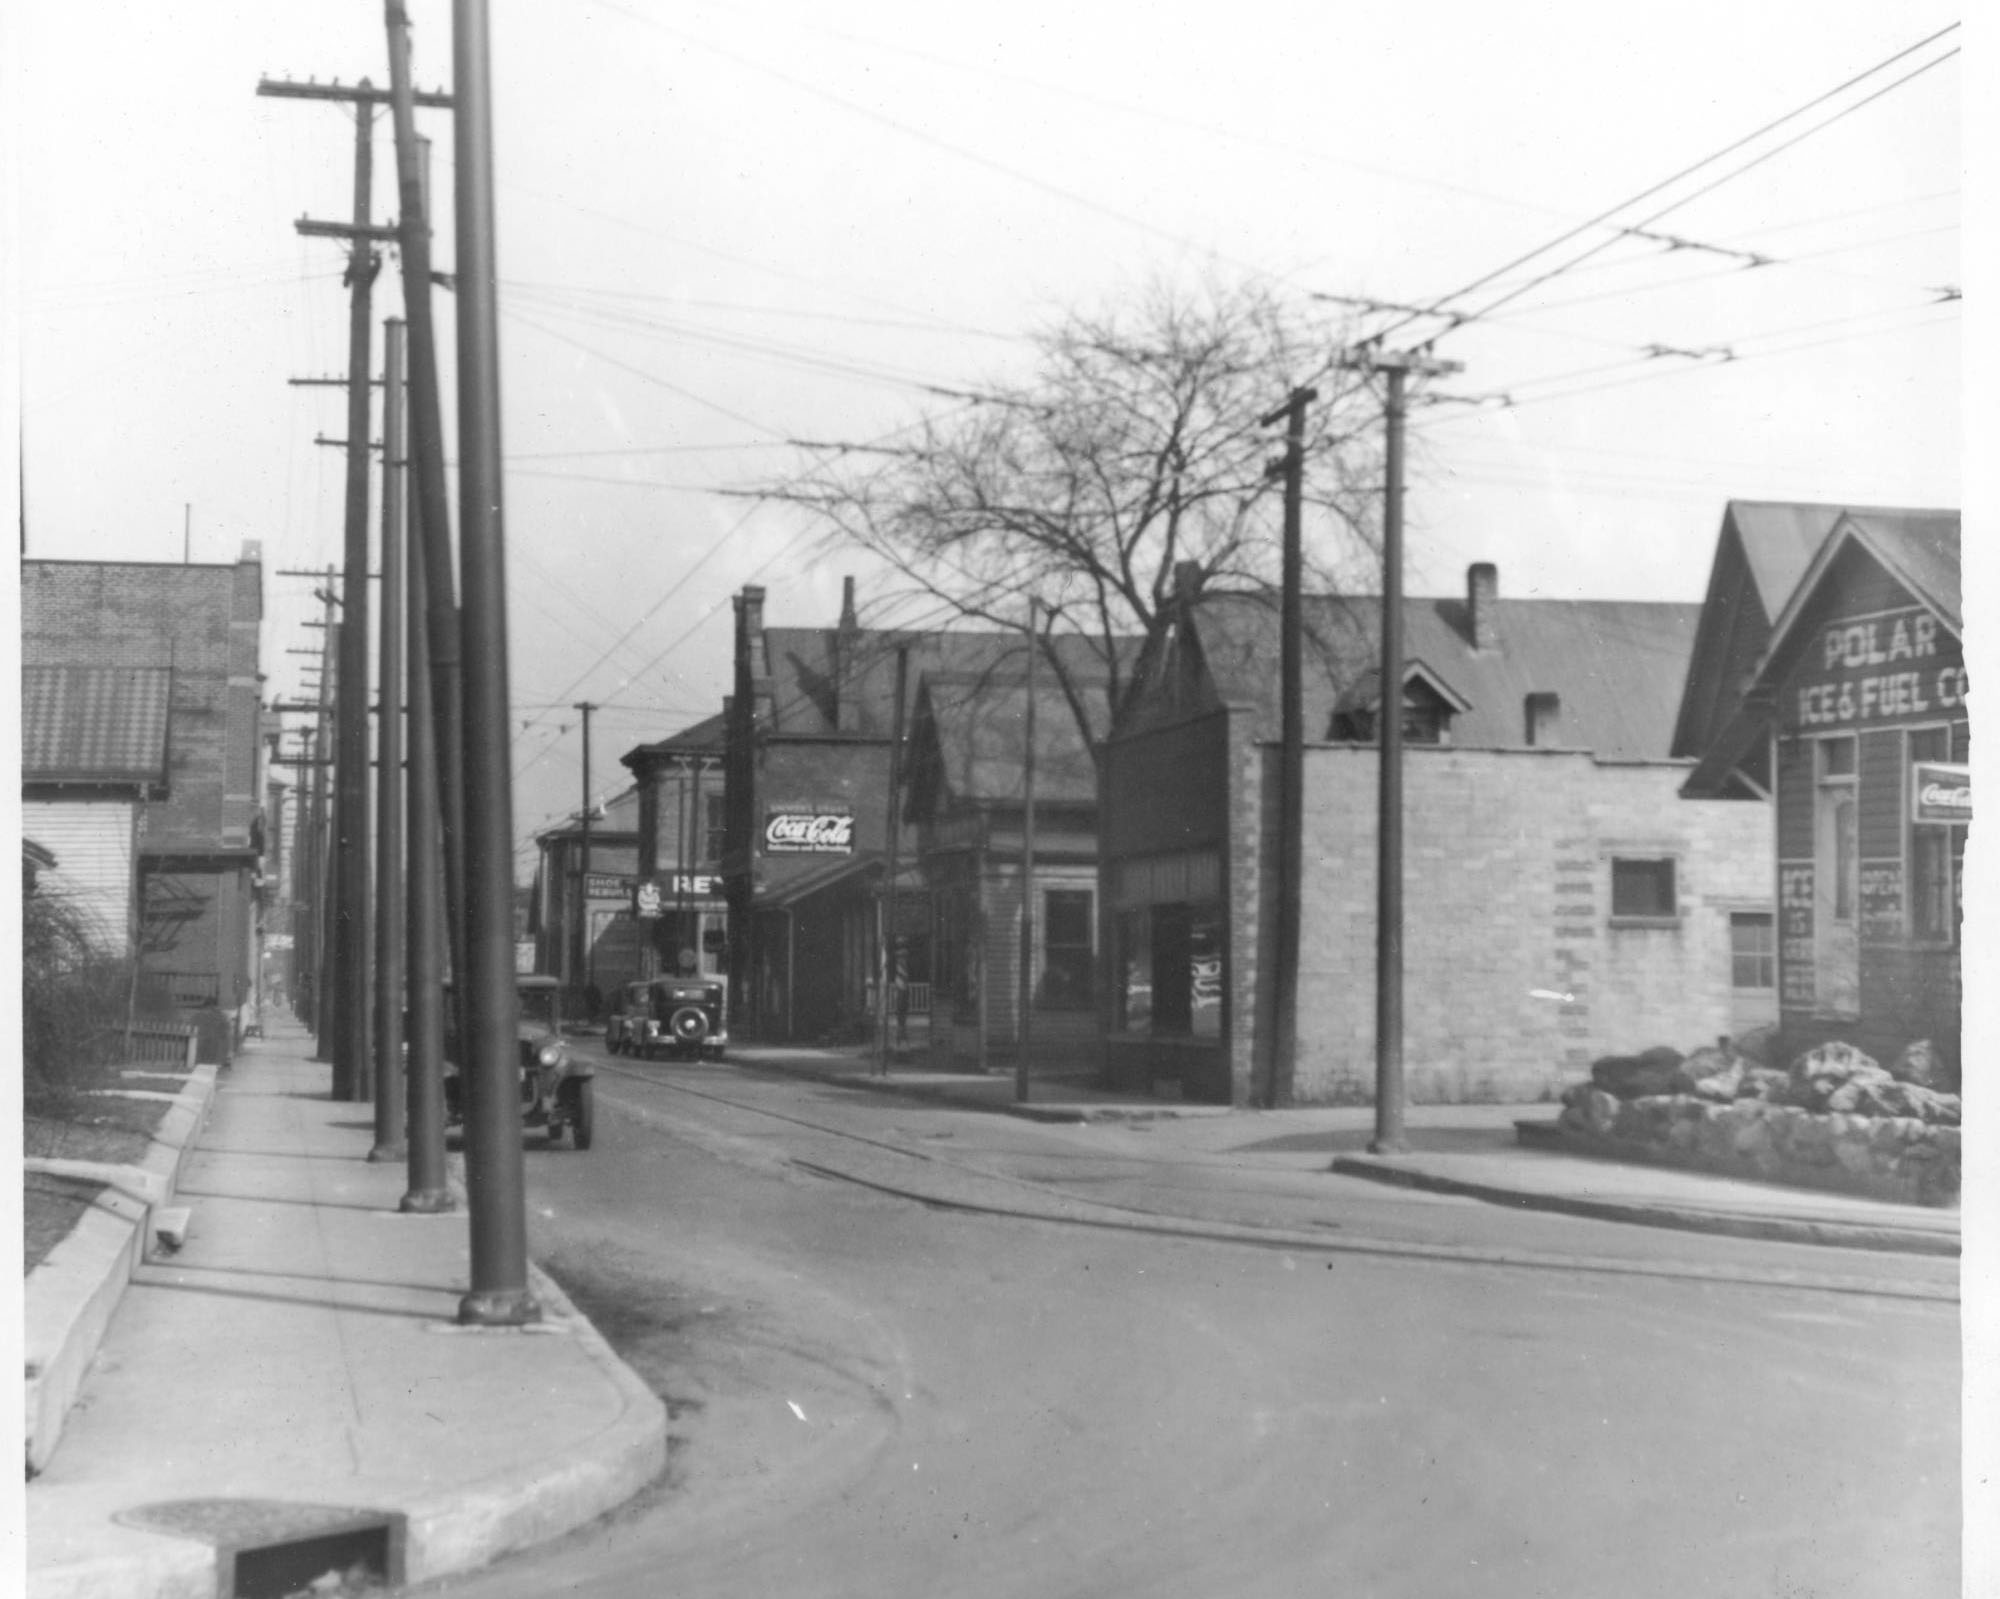
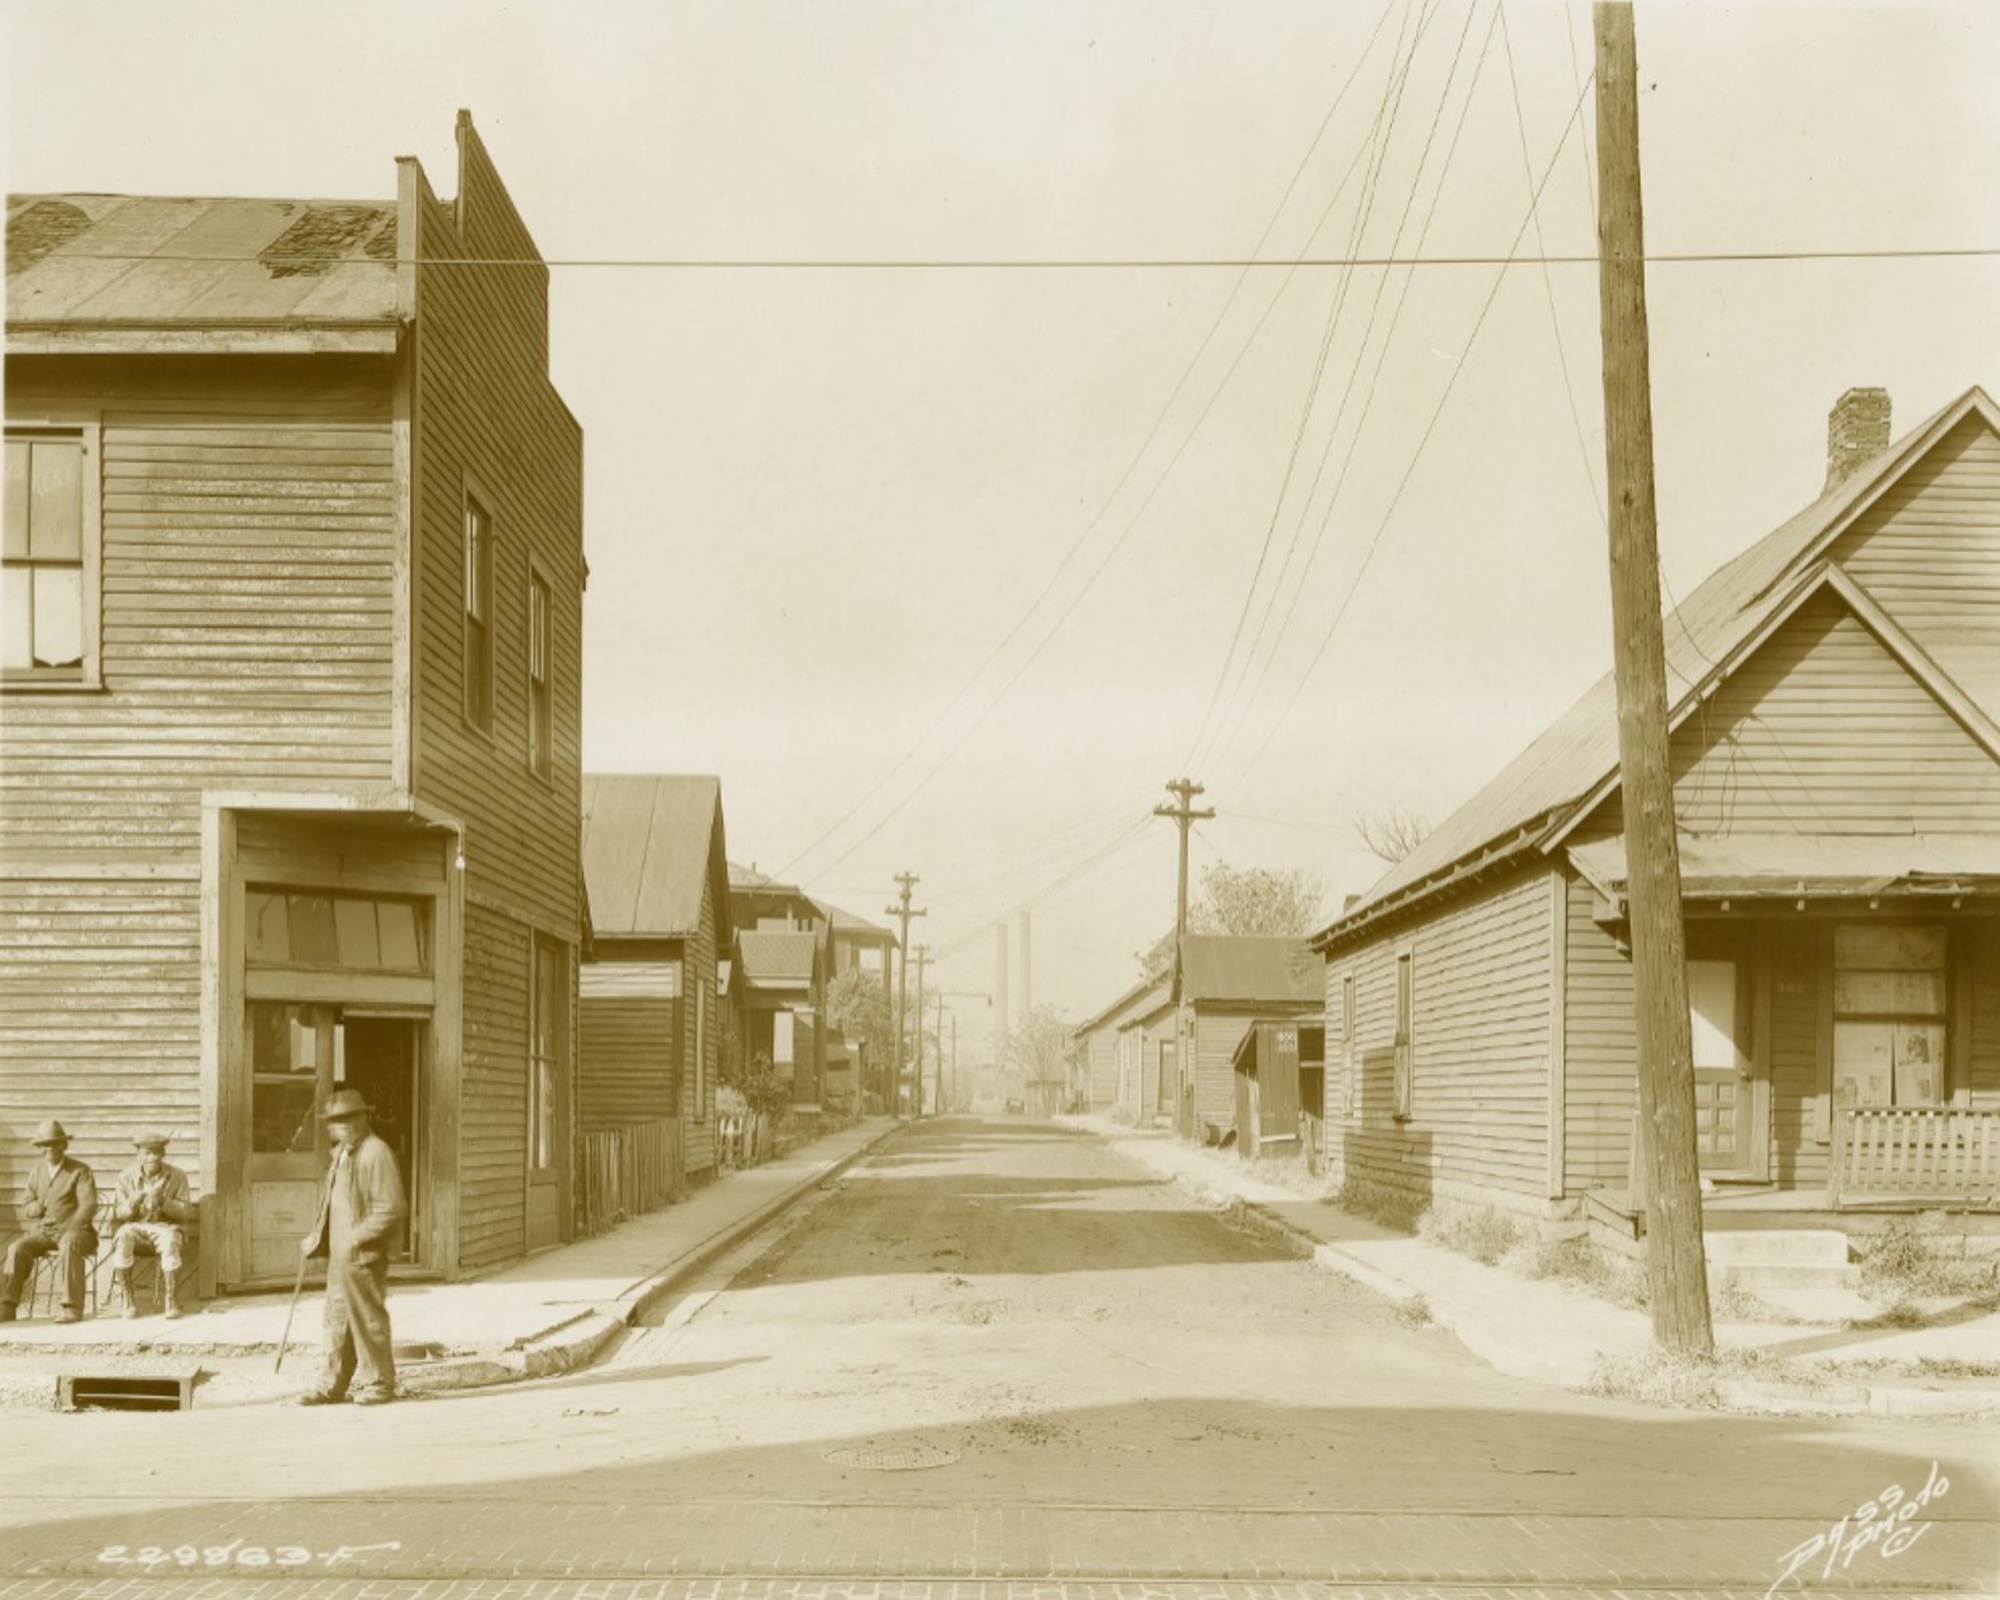
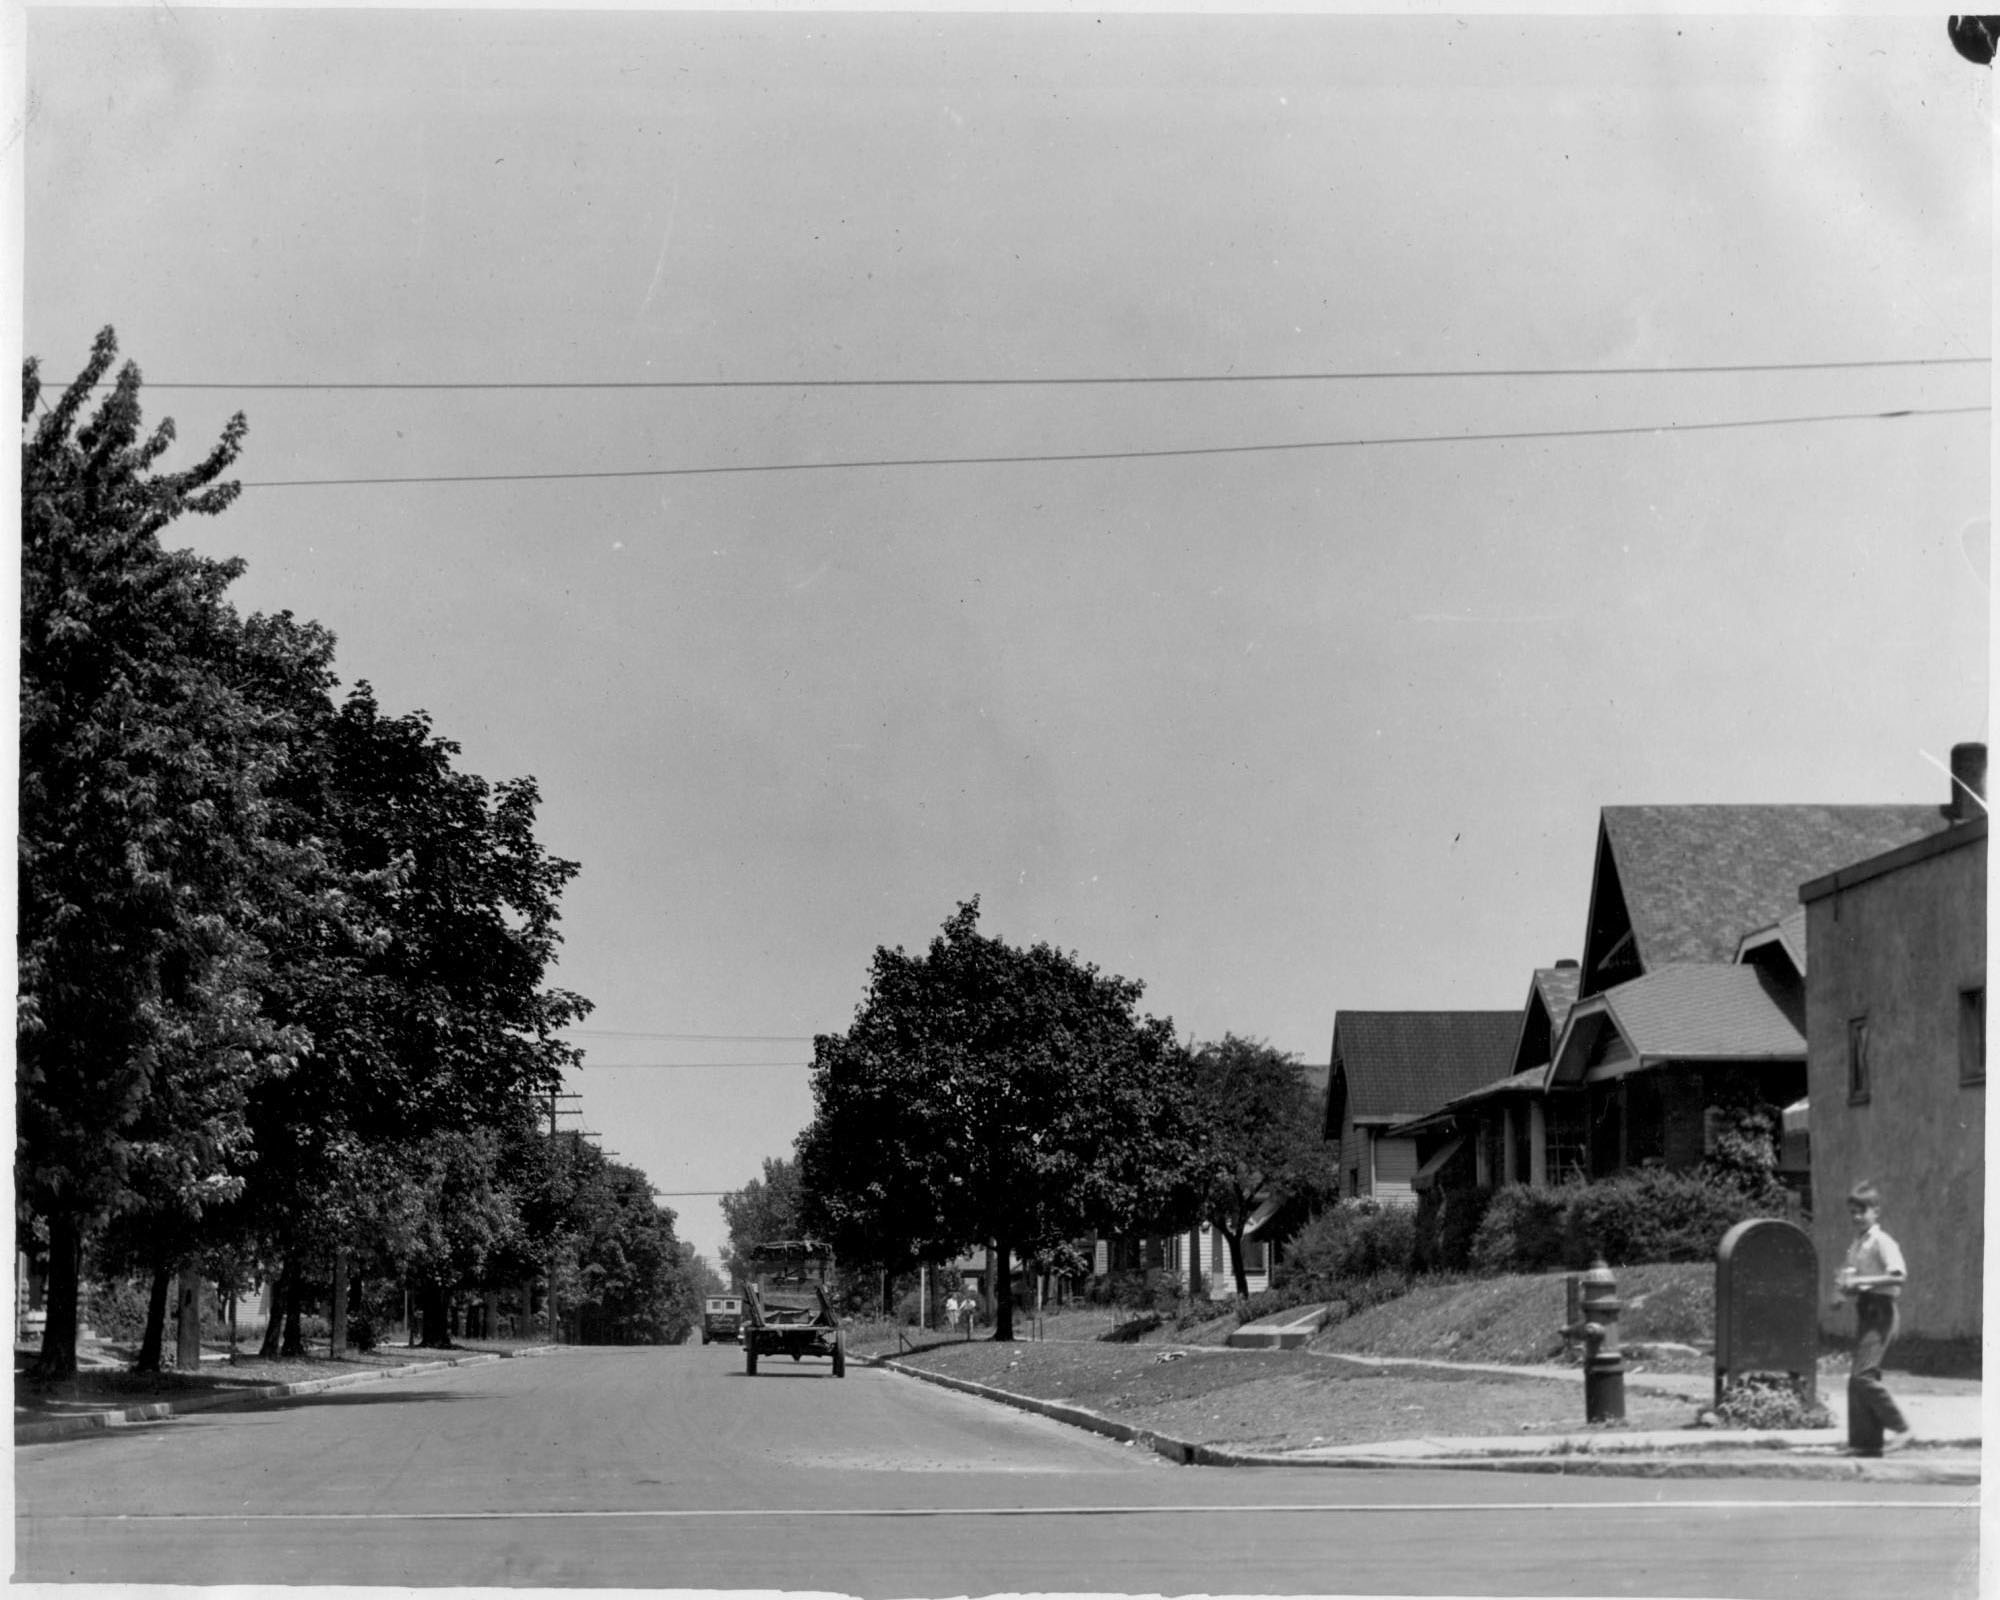
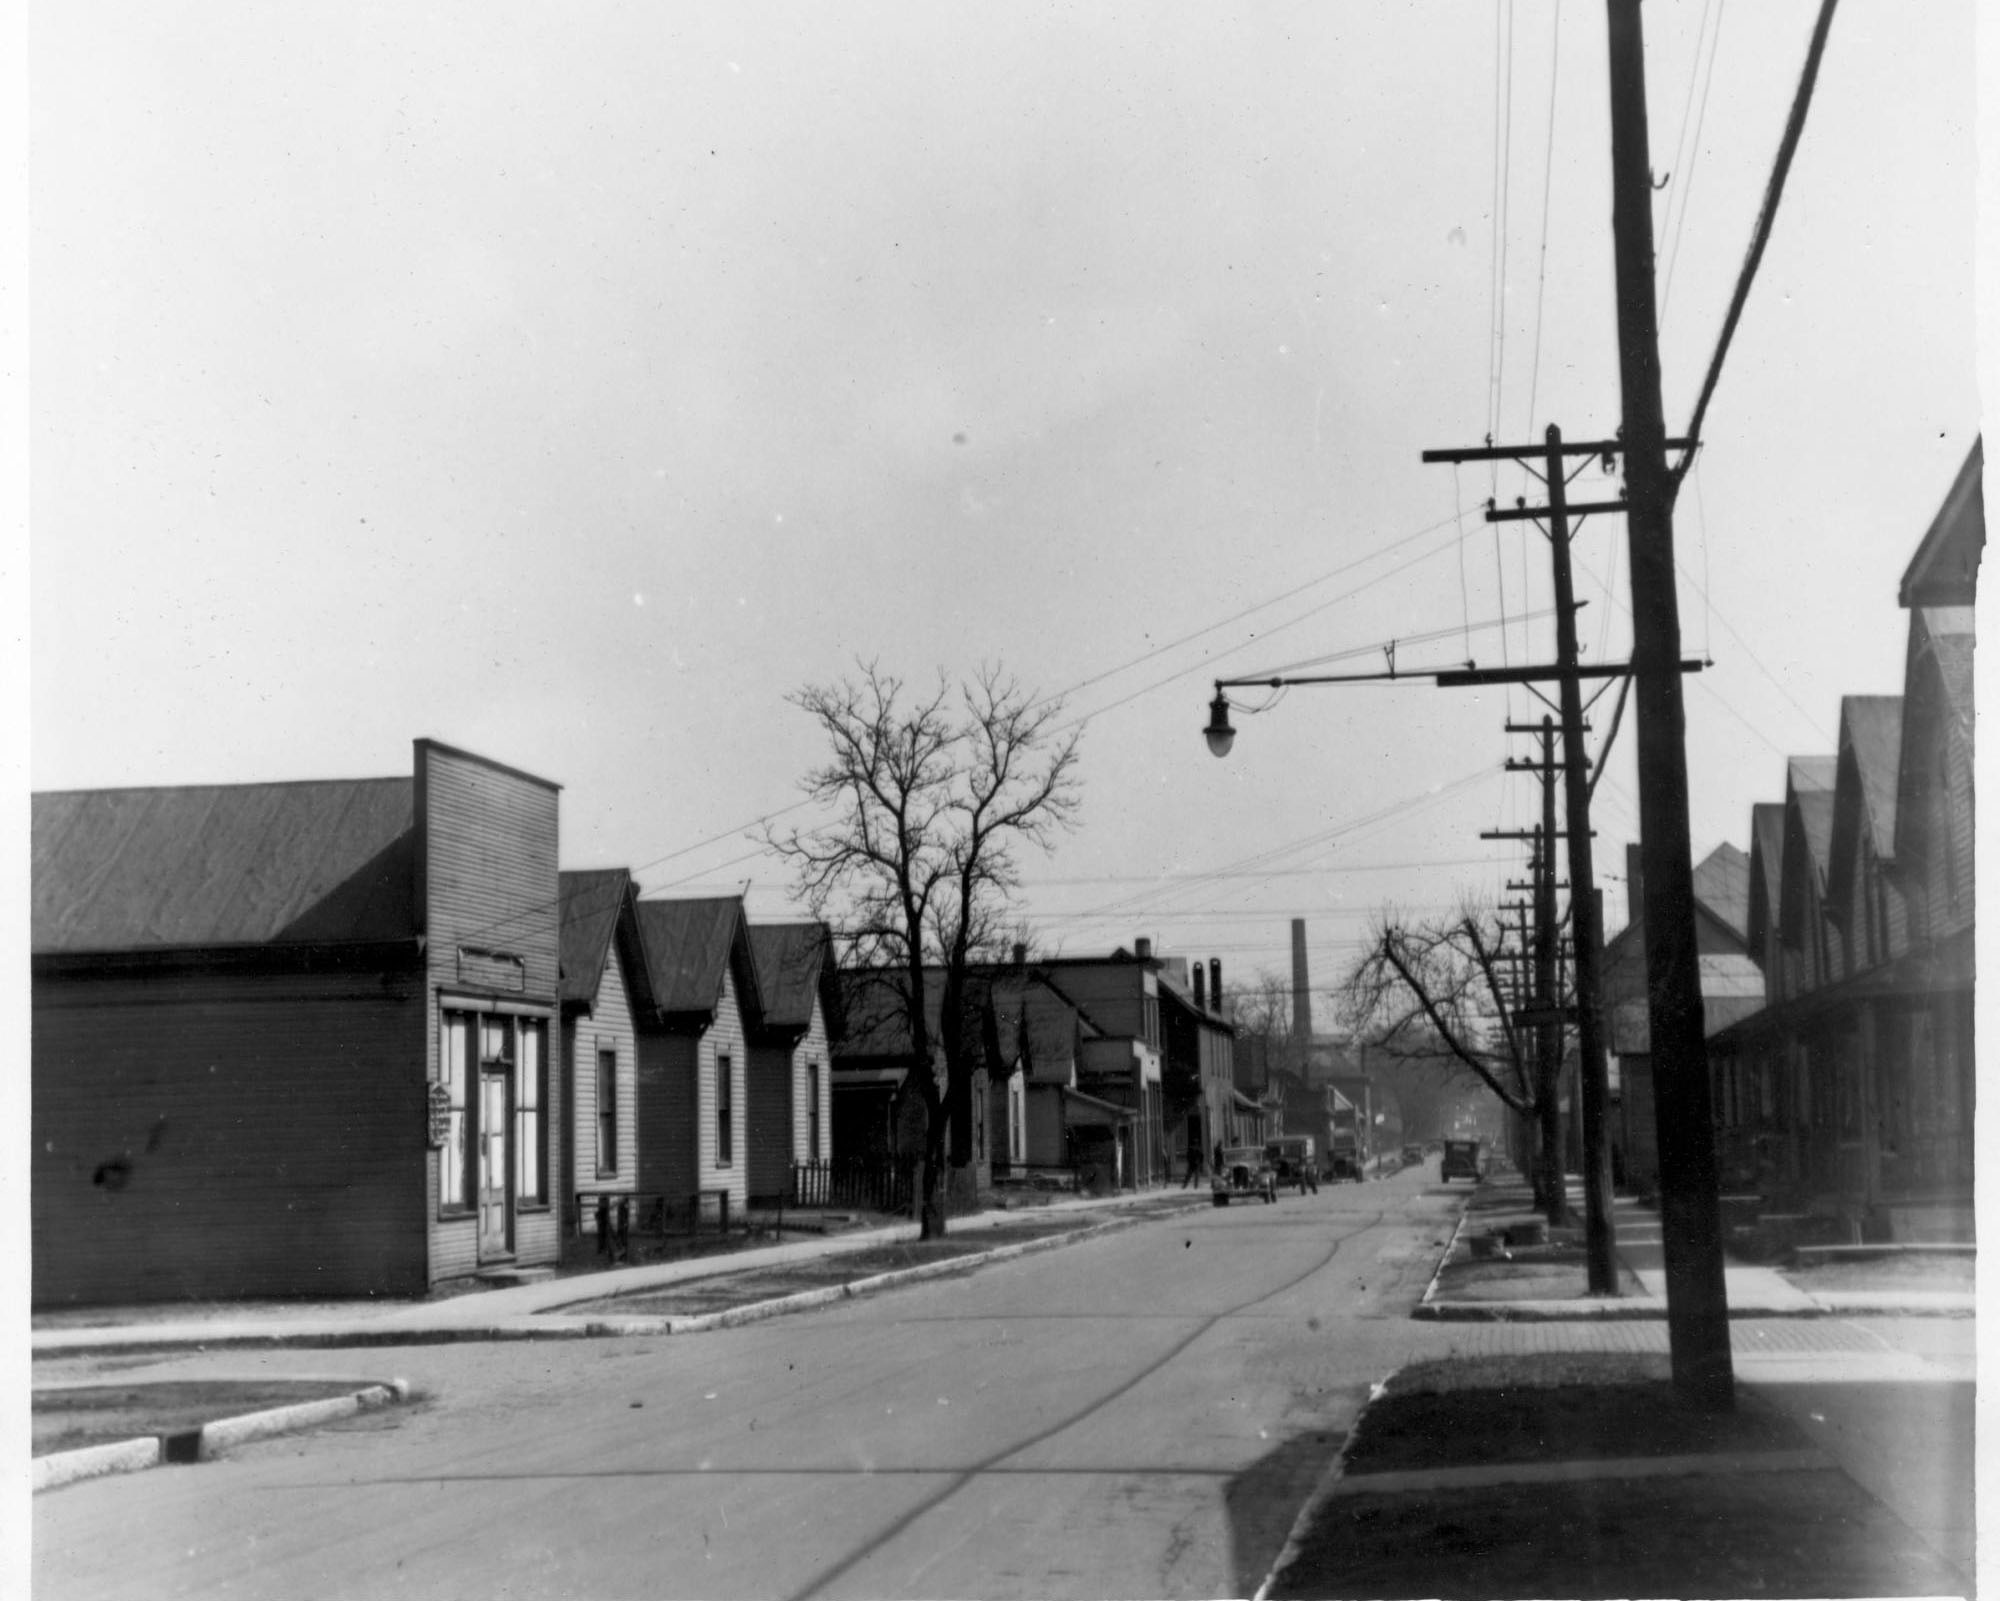
Scroll through these photographs show neighborhoods at the time they were evaluated and the grade they received.
Redlined Neighborhoods were Often in Good Condition
Housing age weighed heavily on redlining district evaluations. Logic seemingly would dictate that many dwellings in the C “Definitely Declining” and D “Hazardous” categories would be in poor condition – exhibiting such characteristics as falling siding, holes in roofs, crumbling foundations, etc. In fact, much devalued housing stock included modest vernacular workers’ cottages located in dense neighborhoods. Photographs taken during the same period show homes in good-to-decent condition. These photos, reinforced by evidence, suggest that the racial and economic characteristics of neighborhood residents largely determined classification on the Area Description Forms.
Scroll through the photos.
Modern Implications
Redlining has had long-standing impacts on the way we purchase homes with mortgage loans today. The mortgage lending system of the 1930s created the financing system that most Americans still use to become homeowners. Race, color, national origin, and religion affected the redlining map evaluations, which in turn determined which people or neighborhoods received government-backed mortgages. Redlining created cultural and financial dynamics that favored white and middle-class homebuyers while adversely affecting racial and economic minorities. The city’s African American community felt this impact most strongly, not for a few years but for decades.
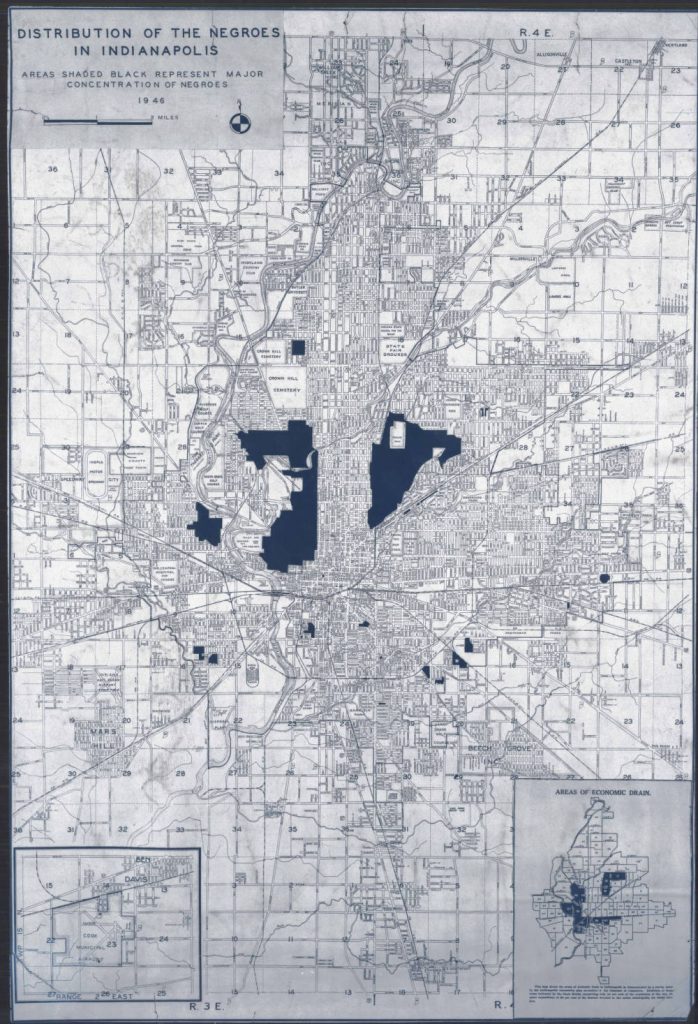
The Indianapolis Chamber of Commerce produced a map in 1946 titled “Distribution of Negroes in Indianapolis.” Where Blacks residents lived a year after World War II corresponded closely to Black-majority redlining tracts. Eighty years later, most of these districts have remained predominantly Black. A few areas have experienced major land-use changes via displacement, including “slum clearance” projects (1930s-1950s), I-65/70 downtown highway construction (1960s-1970s), and the redevelopment of the IUPUI campus (1970s-2000s) and White River State Park (1970s-1990s).
Similarities between the Indianapolis redlining map of 1937 and another 1946 Chamber of Commerce map titled “Areas of Economic Drain” are even more striking. The later map reveals that civic leaders began to track land for redevelopment, which led inevitably to displacement of their residents. Poor neighborhoods became more segregated, with significant implications for education, city services, and other urban amenities.
White home seekers obtained mortgages and built generational wealth, which could be passed down to their children and grandchildren for several generations. In contrast, people of color, some immigrants, some religious groups, and others, were effectively shut out of homeownership opportunities. People who could not obtain favorable mortgages lost decades of investment in desirable properties, thereby missing out on one of the primary ways in which Americans build wealth across generations. Passage of the Fair Housing Act in 1968 finally made such discriminatory lending practices unlawful.
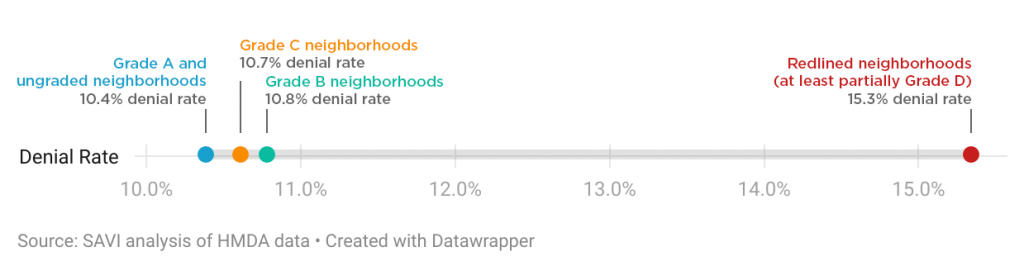
The harm of redlining continues today. Looking at loan applications filed in Central Indiana between 2007 and 2020, Polis Center researchers for the SAVI community information system found that mortgage applications were more likely to be denied in historically redlined areas. Black borrowers were twice as likely to be denied a loan as white borrowers – even with similar income and debt profiles. And no matter the race, income, and debt of a borrower, an applicant was 50 percent more likely to be denied a loan in a previously redlined neighborhood. While denial rates have decreased slightly in recent years, these denial rates still have been high in central Indianapolis, where many neighborhoods had been redlined.
Property appraisers, lenders and/or real estate agents also engaged in other discriminatory housing practices that hurt Black homeownership. They sometimes devalued a property based on their own discriminatory bias as it related to race, color, or national origin. In a practice known as “reverse redlining,” some lenders also targeted majority low-income, Black, and Latino neighborhoods with higher discriminatory mortgage rates than their white counterparts.
At times, even race-neutral policies have had discriminatory effects. Reverse mortgages allow homeowners to remain in their homes while borrowing against its equity. Designed to provide security to senior citizens with limited retirement income, these mortgages result in foreclosure six times higher in predominantly Black neighborhoods than in white neighborhoods. Low wages and rising real estate pricing are market-driven yet make it increasingly difficult for lower-income households to afford safe, economical housing. Finally, zoning that limits multi-family housing types and establishes minimum lot sizes for first-floor square footage continue to deter racial and economic diversity in neighborhoods.
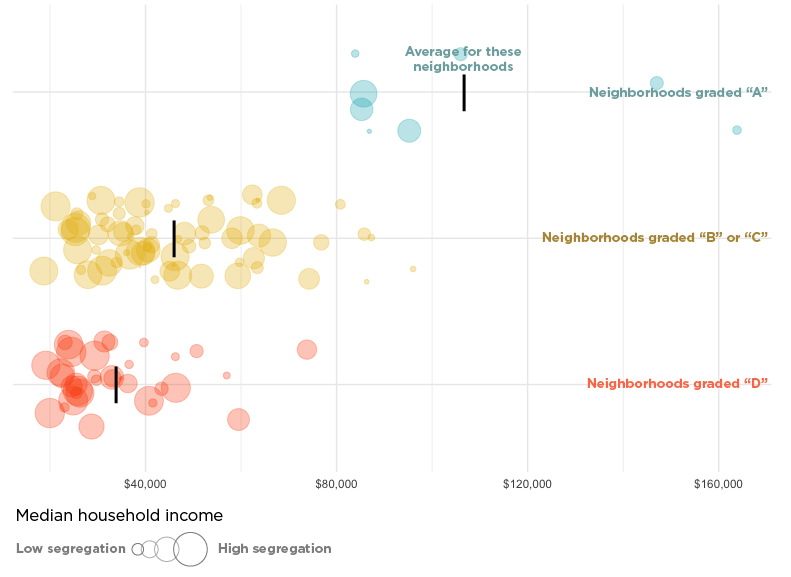
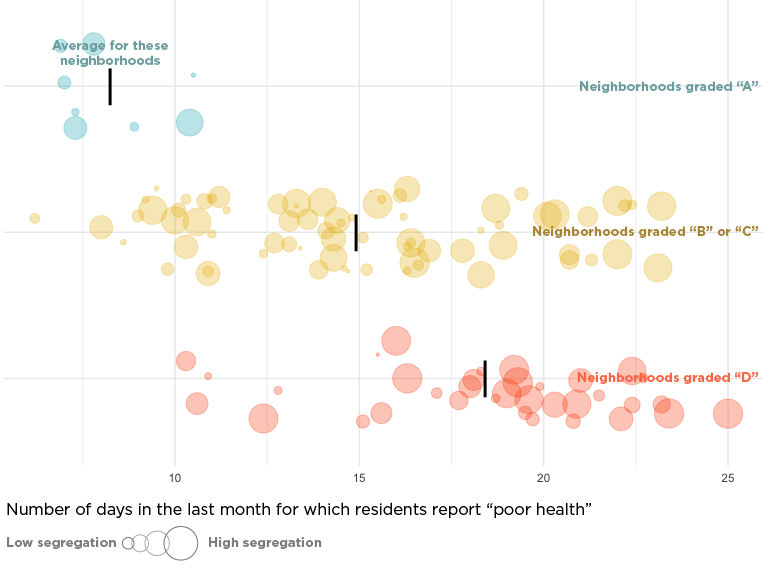
Each of these practices have negatively impacted historically redlined neighborhoods by limiting opportunity, hindering equitable investment, and affecting people of color especially. Neighborhoods historically cut off from investment continue to experience reduced wealth opportunities, greater poverty, and more health issues than areas that have not experienced such discrimination.
What is the history of your neighborhood?
Was your neighborhood redlined? Explore your neighborhood or other points of interest using this map, which overlays the 1937 redlining district map of Indianapolis with the Polis Center’s SAVI Community Profiles. These Community Profiles provide reliable indicators, or measures, about neighborhoods as they exist today.
To explore a neighborhood on the map, click on a location. The box will show that location’s:
- 1937 HOLC map district grade
- 1937 Area Description form for that location
- A link to view the SAVI Community Profile for this district
- The area description form
SAVI Community Profile data featured include:
- Median Household Income—the amount at which half of the households in the area have more income and half have less income. This is an indicator of economic status.
- Tree Canopy—determined as a percentage of the land area. This percentage indicates investment/disinvestment and quality of life issues, particularly involving health and the environment.
- Vacancy Rate—calculated as the total vacant housing units as a percentage of total units. This is an indicator of investment/disinvestment and quality of life issues.
- Median Assessed Value-Residential—the value at which half of the properties in an area have a higher value and half have a lower value. This value is an indicator of economic status and is a good metric to evaluate opportunities for home ownership and the accumulation of generational wealth.
- Racial & Ethnic Diversity Index—a number between zero and one, where numbers at or near zero indicate low diversity and numbers approaching one signal high diversity. The racial/diversity index, thus, reveals implicit racial segregation. The ability to measure segregation is key in understanding the impact of discriminatory housing policies.
- Population—number of people in an assessment area.
These neighborhoods approximately match the redlining districts. They are defined by selecting census block groups, which do not precisely match the boundaries of redlining districts.
To compare Indianapolis to other cities, see University of Richmond’s Mapping Inequality project.
Bibliography
- Biggs, Heidi, Shellye Suttles and Shaowen Bardzell. “Redlining Maps and Terrains of Sustainability: Interdisciplinary Mapping of Racialized Redlining to Present-Day Sustainability Agendas in HCI.” Proceedings of the 2023 CHI Conference on Human Factors in Computing Systems (CHI ’23), April 23-28, 2023, Hamburg Germany. ACM, New York, NY, USA. https://doi.org/10.1145/3544548.35814912.
- Blumgart, Jake. “Redlining Didn’t Happen Quite the Way We Thought It Did.” Governing: The Future of States and Localities. September 21, 2021. https://www.governing.com/context/redlining-didnt-happen-quite-the-way-we-thought-it-did.
- Connolly, N.D.B. A World More Concrete: Real Estate and the Remaking of Jim Crow South Florida. Chicago: University of Chicago Press, 2014.
- Eviction Lab. Princeton University. Indianapolis Profile, 2016. https://evictionlab.org/map/#/2016?geography=states&type=er&locations=18,-86.292,39.907
- Faber, Jacob W. “We Built This: Consequences of New Deal Era Intervention in America’s Racial Geography.” American Sociological Review, vol. 85, no. 5. October 2020: 739–75. https://doi.org/10.1177/0003122420948464.
- Fair Housing Center of Central Indiana. Exhibit. “Unwelcomed: A Fair Housing History of Sales & Lending Discrimination Exhibit.” 2022.
- Fair Housing Center of Central Indiana. The State of Fair Housing in Indiana Report. 2019. https://www.fhcci.org/wp-content/uploads/2020/01/2019-State-of-Fair-Housing-Report.pdf.
- Fair Housing Center of Central Indiana. Video. “History of Redlining – Indianapolis, IN.” 2020. https://www.youtube.com/watch?v=kX_W_XRNHJ4&t=7s
- Fishback, Price V., Jonathan Rose, Kenneth A. Snowden and Thomas Storrs. “New Evidence on Redlining by Federal Housing Programs in the 1930s.” National Bureau of Economic Research, Working Paper. 2020-2021. https://www.nber.org/papers/w29244.
- Hillier, Amy E. “Redlining and the Home Owners’ Loan Corporation.” Journal of Urban History, vol. 29, no. 4. May 2003: 394–420. https://doi.org/10.1177/0096144203029004002.
- Michney, Todd M. “How the City Survey’s Redlining Maps Were Made: A Closer Look at HOLC’s Mortgagee Rehabilitation Division.” Journal of Planning History. May 2021. https://doi.org/10.1177/15385132211013361.
- Mitchell, Bruce and Juan Franco. “HOLC ‘Redlining’ Maps: The Persistent Structure of Segregation and Economic Inequality.” National Community Reinvestment Coalition. 2018. https://ncrc.org/wp-content/uploads/dlm_uploads/2018/02/NCRC-Research-HOLC-10.pdf.
- Moxley, Donovan and Burnell Fischer. “Historic HOLC Redlining in Indianapolis and the Legacy of Environmental Impacts.” Journal of Public and Environmental Affairs. Volume 1, Issue 1, April 2020, https://scholarworks.iu.edu/journals/index.php/jpea/article/view/30321/34726.
- National Fair Housing Alliance. “Where You Live Matters.” 2016. https://nationalfairhousing.org/wp-content/uploads/2021/01/Where-You-Live-Matters-Slide-Updated.pdf.
- Nelson, Robert K., LaDale Winling, Richard Marciano, Nathan Connolly, et al. “Mapping Inequality.” American Panorama, ed. Robert K. Nelson and Edward L. Ayers. https://dsl.richmond.edu/panorama/redlining/.
- Nowlin, Matt, Kelly Davila, and Unai Miguel Andres, “Neighborhood Change, 1970-2016: Suburbanization, Gentrification, and Suburban Redevelopment.” SAVI: The Polis Center. Summer 2018. https://www.savi.org/feature_report/neighborhood-change-1970-2016/.
- Robustelli, Tim, Yuliya Panfil, Katie Oran, Chenab Navalkha, and Emily Yelverton. “Displaced in America: Mapping Housing Loss Across the United States.” New America. September 9, 2020. https://www.newamerica.org/future-land-housing/reports/displaced-america/.
- Rothstein, Richard. The Color of Law: A Forgotten History of How Our Government Segregated America, New York: Liveright Publishing Corporation, 2017.
- Ryan, Jordan. “A Judgment Call: Indianapolis, Redlining, & Unjust Legacies.” Wilma Gibbs Moore Racial Injustice Research Fellowship for Indiana Humanities. 2022.
- Steiner, Erik and Matt Nowlin. “Modern Redlining in Indianapolis?” SAVI: The Polis Center. April 14, 2022. https://www.savi.org/2022/04/14/modern-redlining-in-indianapolis/.
- Townsley, Jeramy, Unai Miguel Andres, and Matt Nowlin. “The Lasting Impacts of Segregation and Redlining.” SAVI: The Polis Center. June 24, 2021. https://www.savi.org/2021/06/24/lasting-impacts-of-segregation/.
- Underwriting Manual: Underwriting and Valuation Procedure Under Title II of the National Housing Act, Federal Housing Administration, U.S. Government Printing Office, Washington, D.C., 1938. https://www.huduser.gov/portal/sites/default/files/pdf/Federal-Housing-Administration-Underwriting-Manual.pdf.