Land Use
This map shows mixed-use neighborhoods, where commercial space and housing are near each other. Darker neighborhoods are places where a higher share of residential properties are within a short distance of commercial properties.
Urban Areas
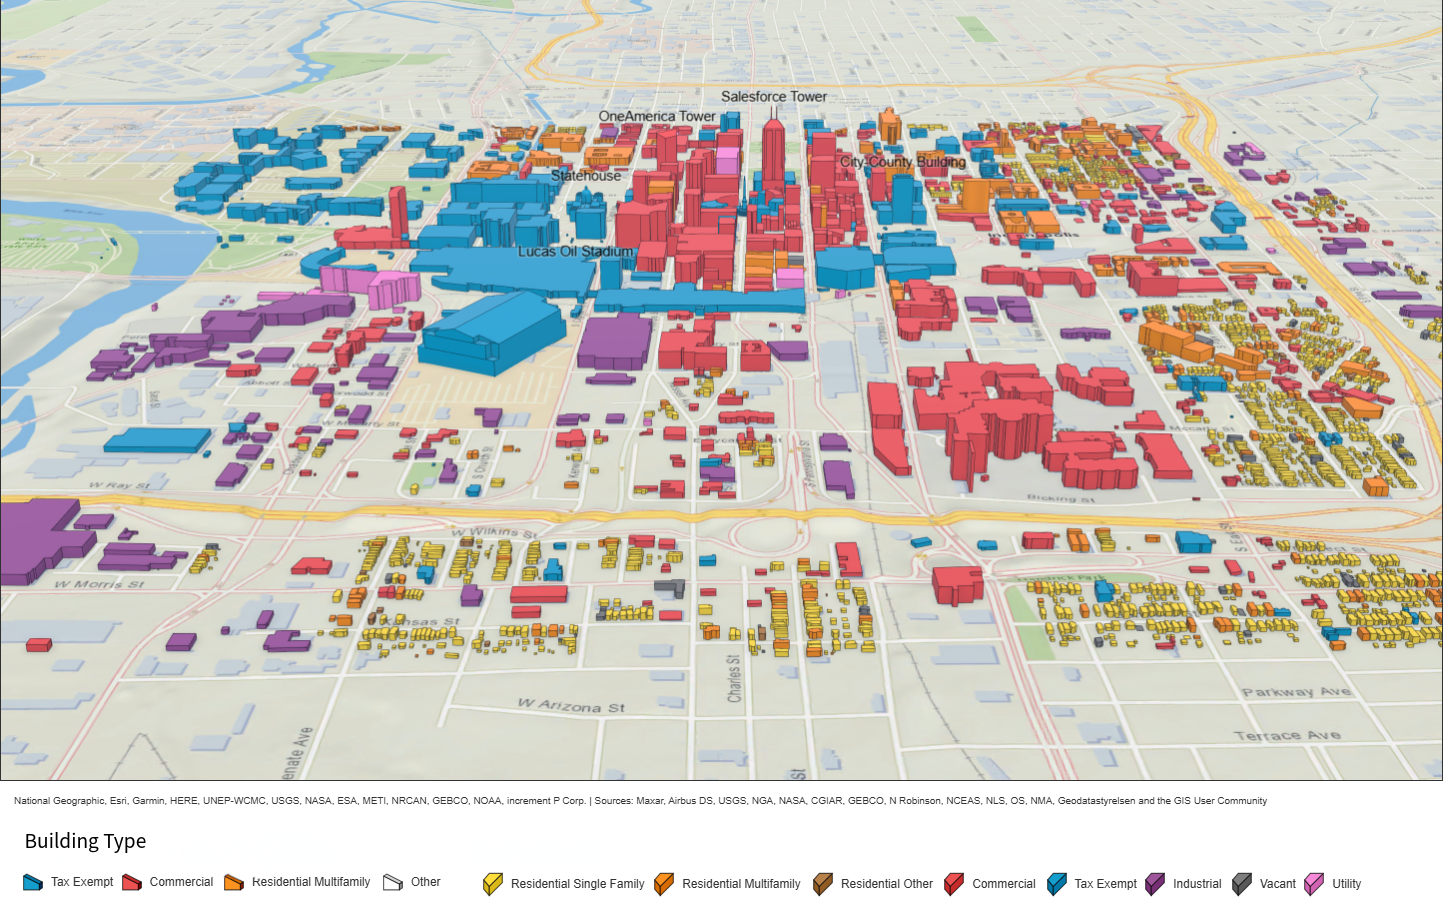
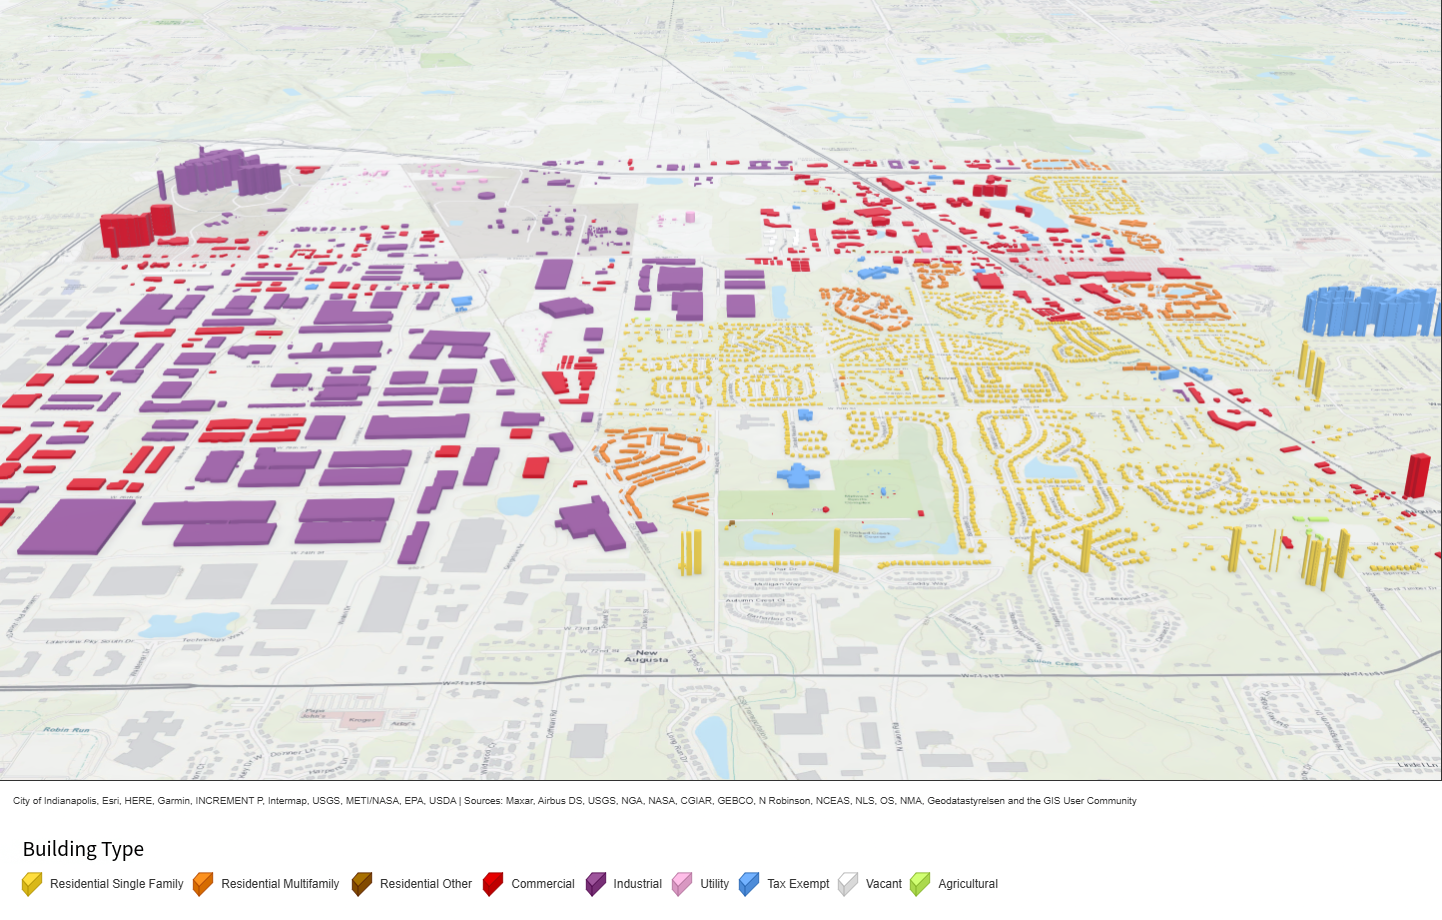
These 3D models illustrate three important ways land use is configured in Indianapolis urban areas. These are “massing models,” which means the buildings are generalized to their approximate shape and size but are not exact architectural models. Buildings are colored according to their land use.
Downtown
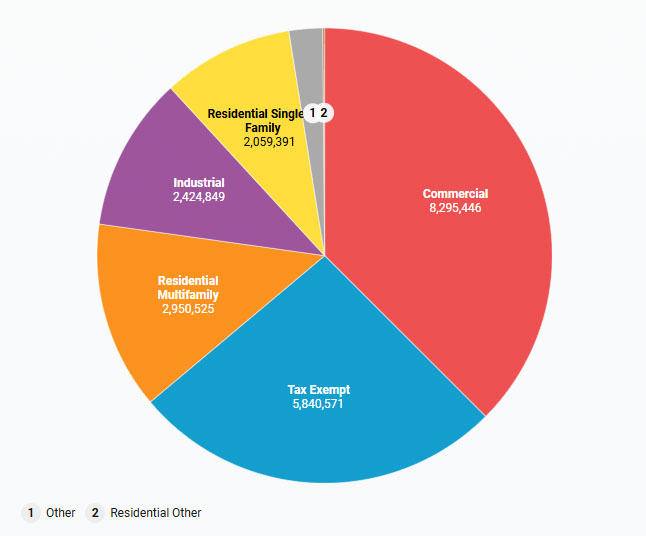
Building footprint area by land use (square feet)
Typology
Central Business District
The core of the city contains mostly commercial and tax-exempt properties (like hospitals, universities, and government buildings). There are also many multifamily residential buildings. Industrial areas are located on the periphery of the central business district. Tax-exempt properties account for 26 percent of building footprint area downtown. These properties do not generate property taxes, which equates to less funding for local government. However, these properties include major employers, including hospitals and universities which account for 45,000 jobs on the west side of downtown.
- Residential Single Family: Detached houses
- Residential Multifamily: Apartment buildings and detached houses divided into two or more units
- Residential Other
- Commercial: Shops, offices, hotels
- Industrial: Factories, warehouses
- Tax Exempt: Churches, schools, government buildings
- Utilities: Power plants, water treatment facilities
- Other
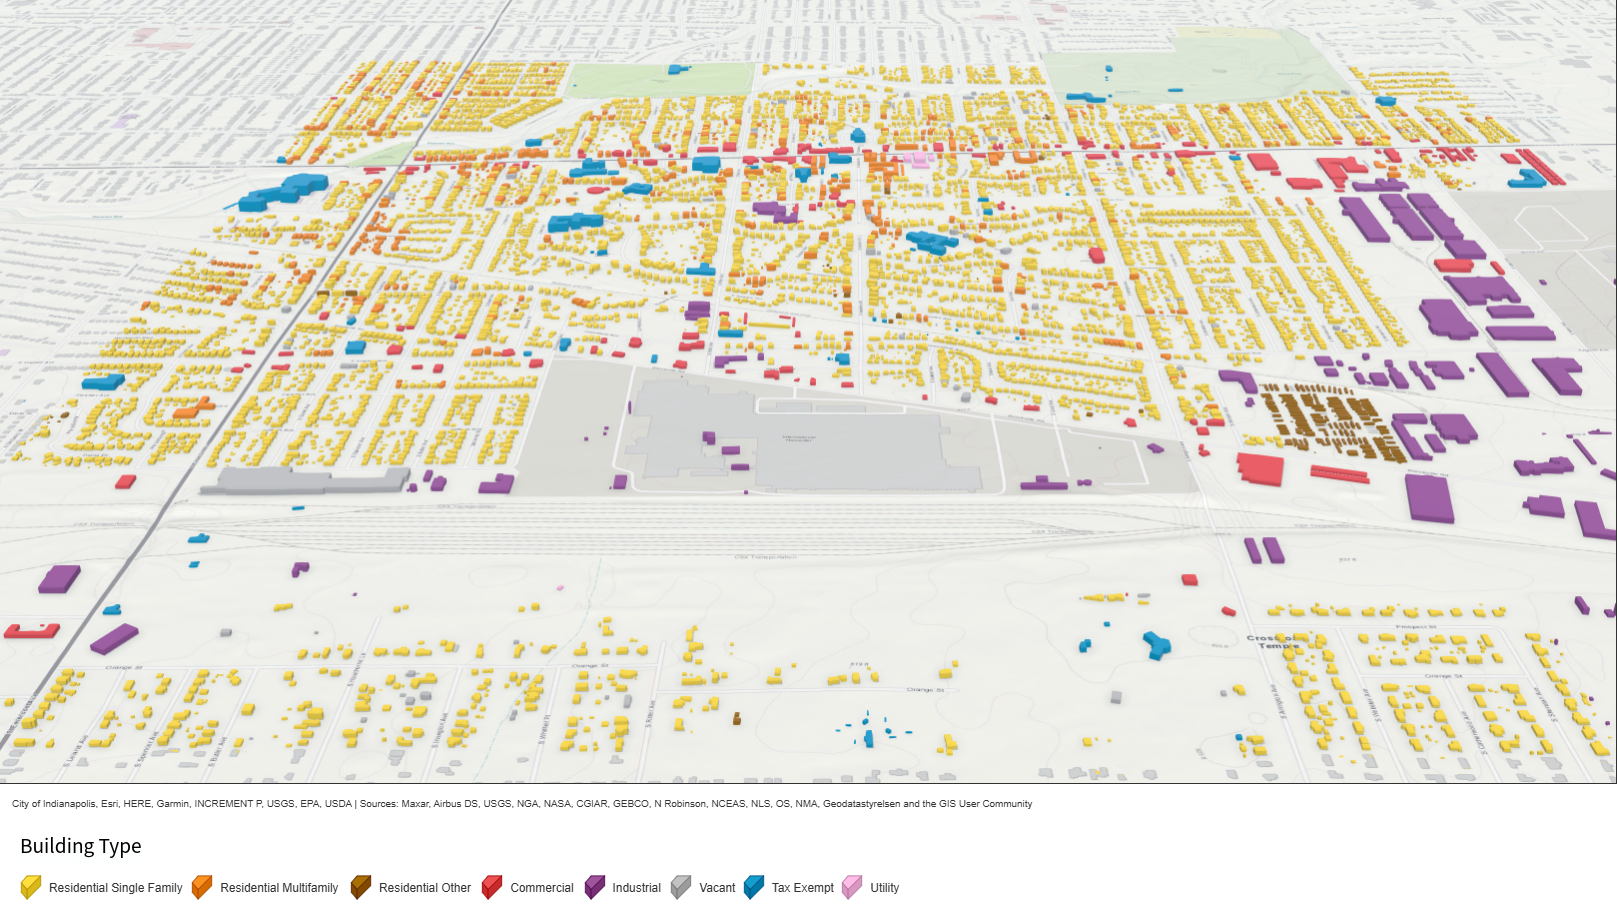
Irvington
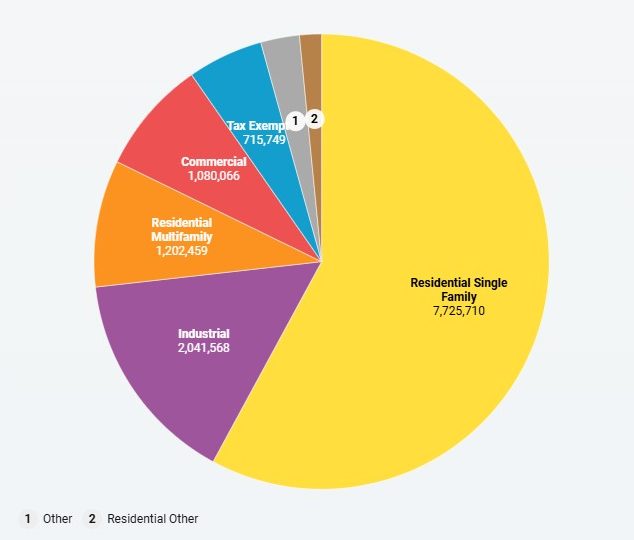
Building footprint area by land use (square feet)
Typology
Neighborhood or Town Center
Similar Places
Fountain Square, Broad Ripple, Downtown Zionsville, Downtown Greenfield
Most of the properties in the area are single-family homes, but multifamily and commercial properties are located along the main street (Washington Street). There are some tax-exempt properties (mostly churches and schools), but they account for only 5 percent of building footprint area, one fifth the amount of tax-exempt properties as downtown.
- Residential Single Family: Detached houses
- Residential Multifamily: Apartment buildings and detached houses divided into two or more units
- Residential Other
- Commercial: Shops, offices, hotels
- Industrial: Factories, warehouses
- Tax Exempt: Churches, schools, government buildings
- Utilities: Power plants, water treatment facilities
- Other
Park 100 (86th Street and Georgetown Road)
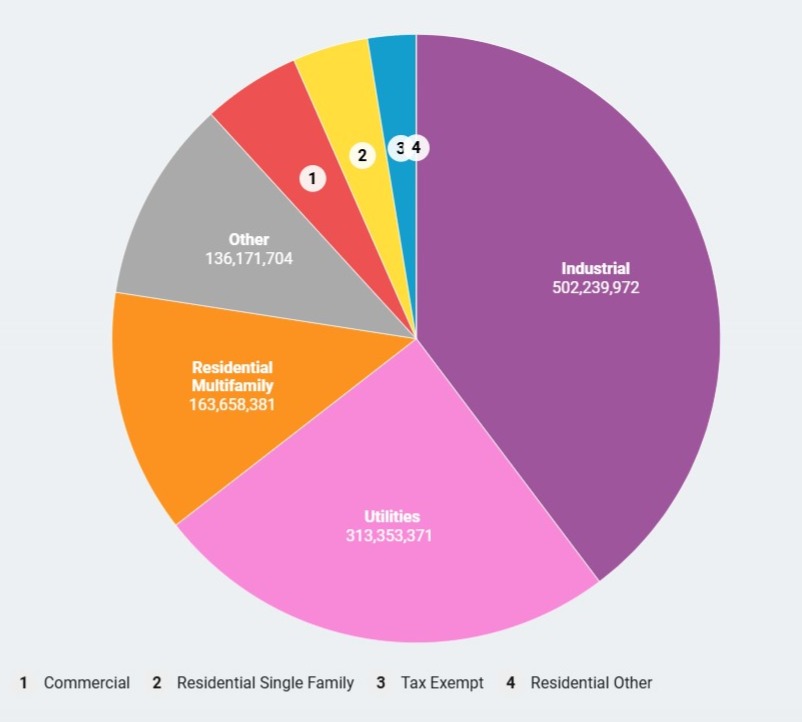
Building footprint area by land use (square feet)
Typology
Suburban Industrial Center
Similar Places
Plainfield, Westfield, Whitestown, Ameriplex Parkway
Close access to the interstate has attracted both industrial development and multifamily residential. Large production and warehouse facilities account for 500 million square feet of building area, and utilities are another 300 million. Warehouses often exist adjacent to residential areas.
- Residential Single Family: Detached houses
- Residential Multifamily: Apartment buildings and detached houses divided into two or more units
- Residential Other
- Commercial: Shops, offices, hotels
- Industrial: Factories, warehouses
- Tax Exempt: Churches, schools, government buildings
- Utilities: Power plants, water treatment facilities
- Other
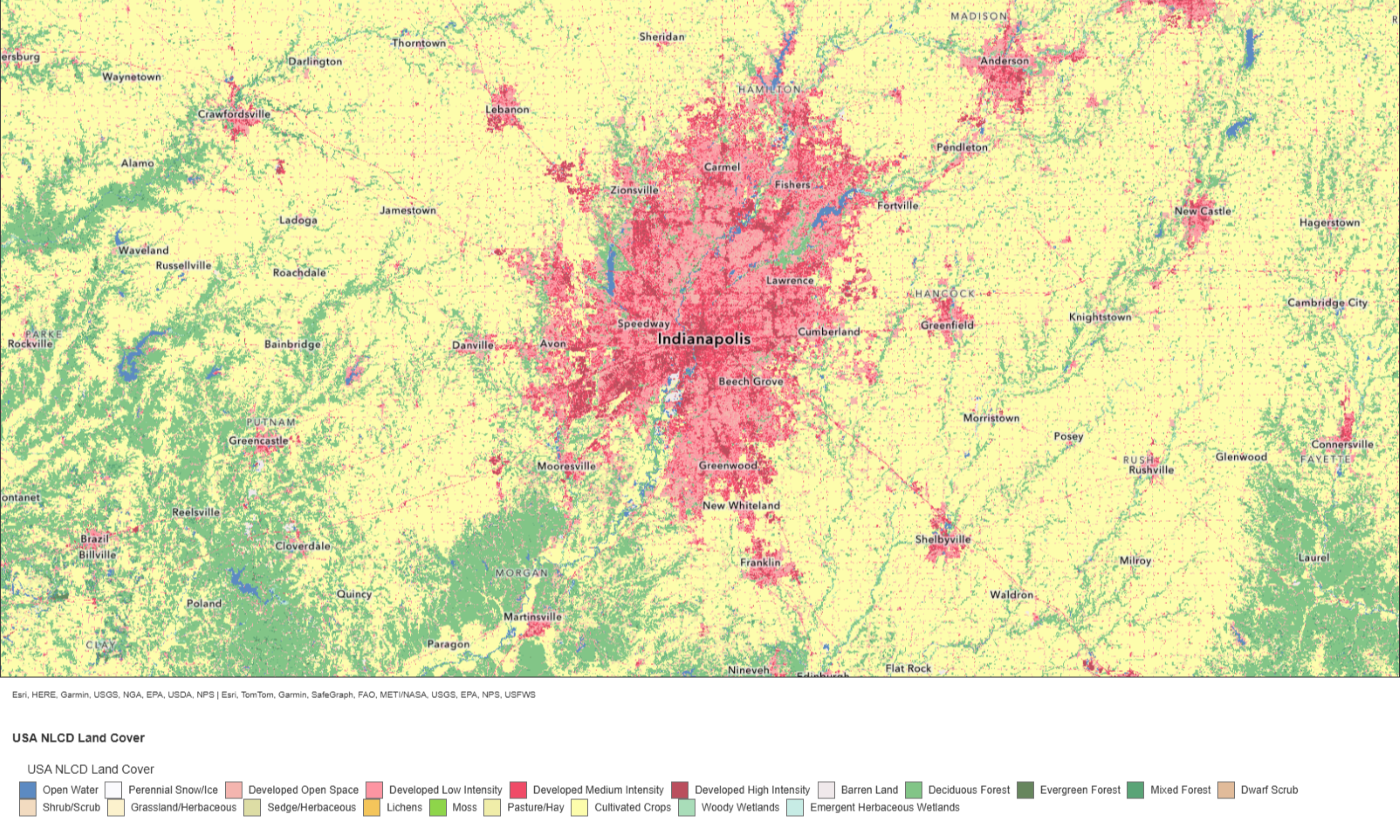
Urbanization
This map shows the land cover as of 2021. Colors represent developed areas (reds), crops (yellows), and forests (greens). View the full interactive map to see the changes in land cover from 2000 to 2021.
Central Hamilton County
After Carmel and Fishers boomed in the 1990s, Westfield expanded rapidly in the between 2000 and 2020. New suburban residential development replaced agricultural land. (U.S. Census Bureau)
Southeastern Boone County
Boone County’s population grew by nearly 50% between 2000 and 2020. Agricultural land was replaced with homes in eastern Boone County and industrial development along Interstate 65. (U.S. Census Bureau)
Plainfield
Industrial development expanded rapidly in Plainfield since 2000. The area has close access to the interstate and air freight, and new warehouses quickly replaced agricultural land. Transportation and warehouse jobs doubled from 4,200 to 8,400 between 2010 and 2018. (U.S. Census Bureau)
Brownfields
Brownfields are areas that are polluted by a previous industrial or commercial use but are now abandoned, vacant, or used in a way that does not match the previous use. These areas are designated by the Indiana Department of Environmental Management according to standards developed by the federal Environmental Protection Agency.
The large number of brownfields in Marion County reveals the industrial nature of Indianapolis from the late nineteenth century through the 1980s, with polluting industries concentrated south of Washington Street.
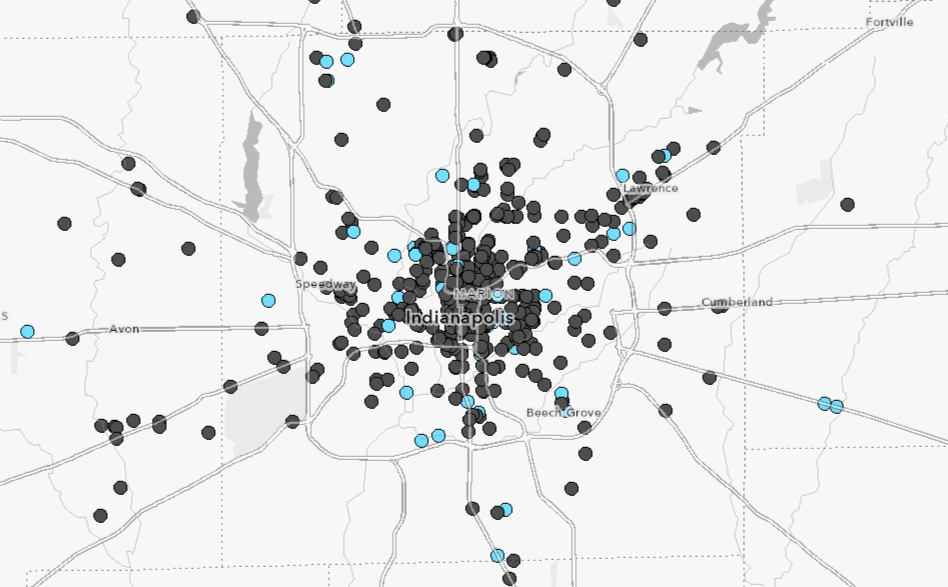
The majority of brownfields in Marion County are active (brown), though there are several that are inactive (blue). To learn more about each site, view the full interactive map.
Agriculture
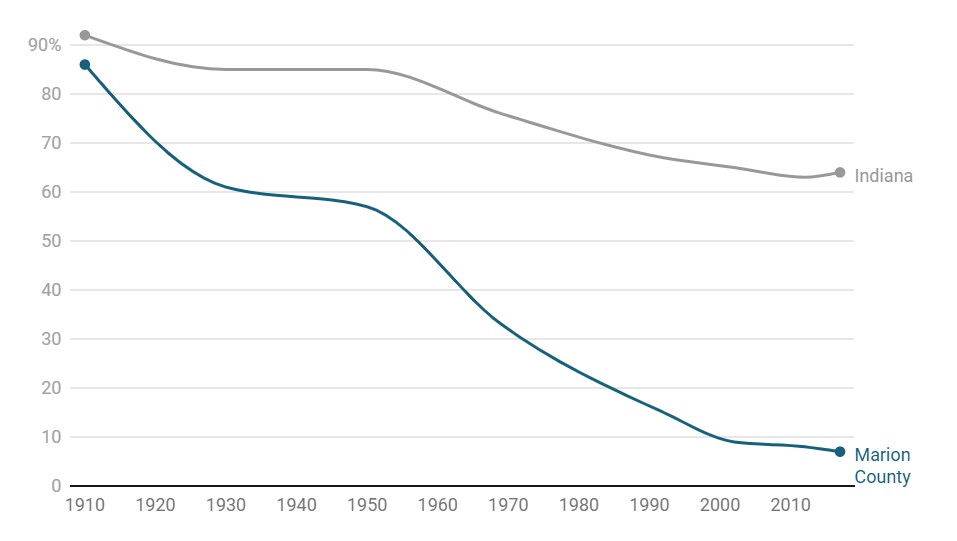
Land in farms
Harvested crop acreage, Marion County
Top 20 Crops Grown in Central Indiana
| Crop | 2020 Acreage |
|---|---|
| Soybeans | 570,677 |
| Corn | 530,623 |
| Wheat | 19,419 |
| Grass | 13,455 |
| Mixed forage | 9,580 |
| CRP | 5,859 |
| Alfalfa | 4,376 |
| Idle | 3,017 |
| Tomatoes | 713 |
| Cover Crop | 462 |
| Sorghum | 458 |
| Cucumbers | 453 |
| Hemp | 360 |
| Spelt | 315 |
| Potatoes | 288 |
| Barley | 269 |
| Beans | 241 |
| Oats | 238 |
| Christmas Trees | 144 |
Source: USDA Farm Services Agency • Get the data
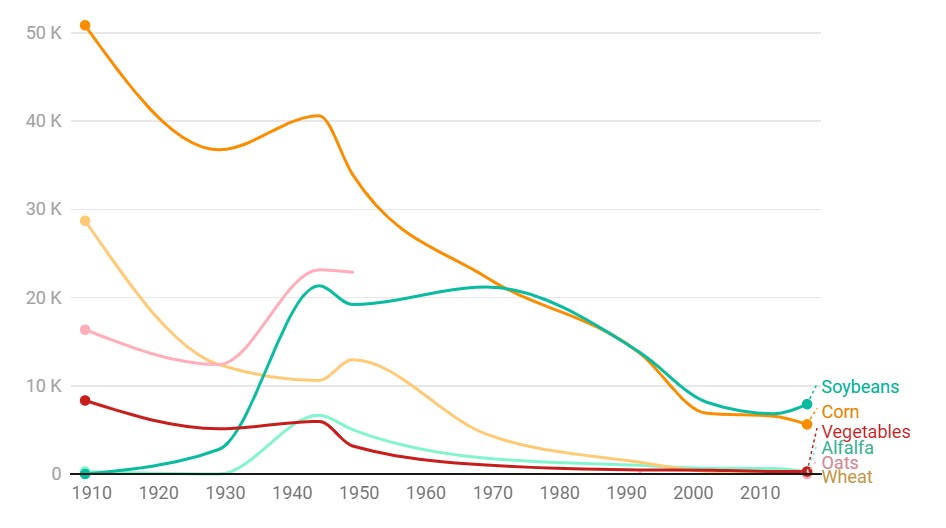
Marion County farmland has been converted into urbanized area in the last century. In 1910, 86 percent of Marion County was farmland. By 2017, that had fallen to just 7 percent. Corn has long been a primary crop in Marion County, but wheat and oats were also important in the early 20th century. These were replaced by soybeans as innovations in the food industry created demand for this crop. Marion County famers grew 8,333 acres of vegetables for sale in 1909 (4 percent of farmland), but this dwindled to 274 aces by 2017 (2 percent of farmland).
Central Indiana is still a major agricultural producer. Over half of land area is farmland (58 percent). This totals 1.5 million acres in 2017 and accounts for one tenth of all farmland in Indiana. At midsummer in 2020, 95 percent of cropland was planted with corn or soybeans. While other crops do not account for substantial acreage, Central Indiana farmers also grow alfalfa (hay), tomatoes, sorghum, cucumbers, and more.
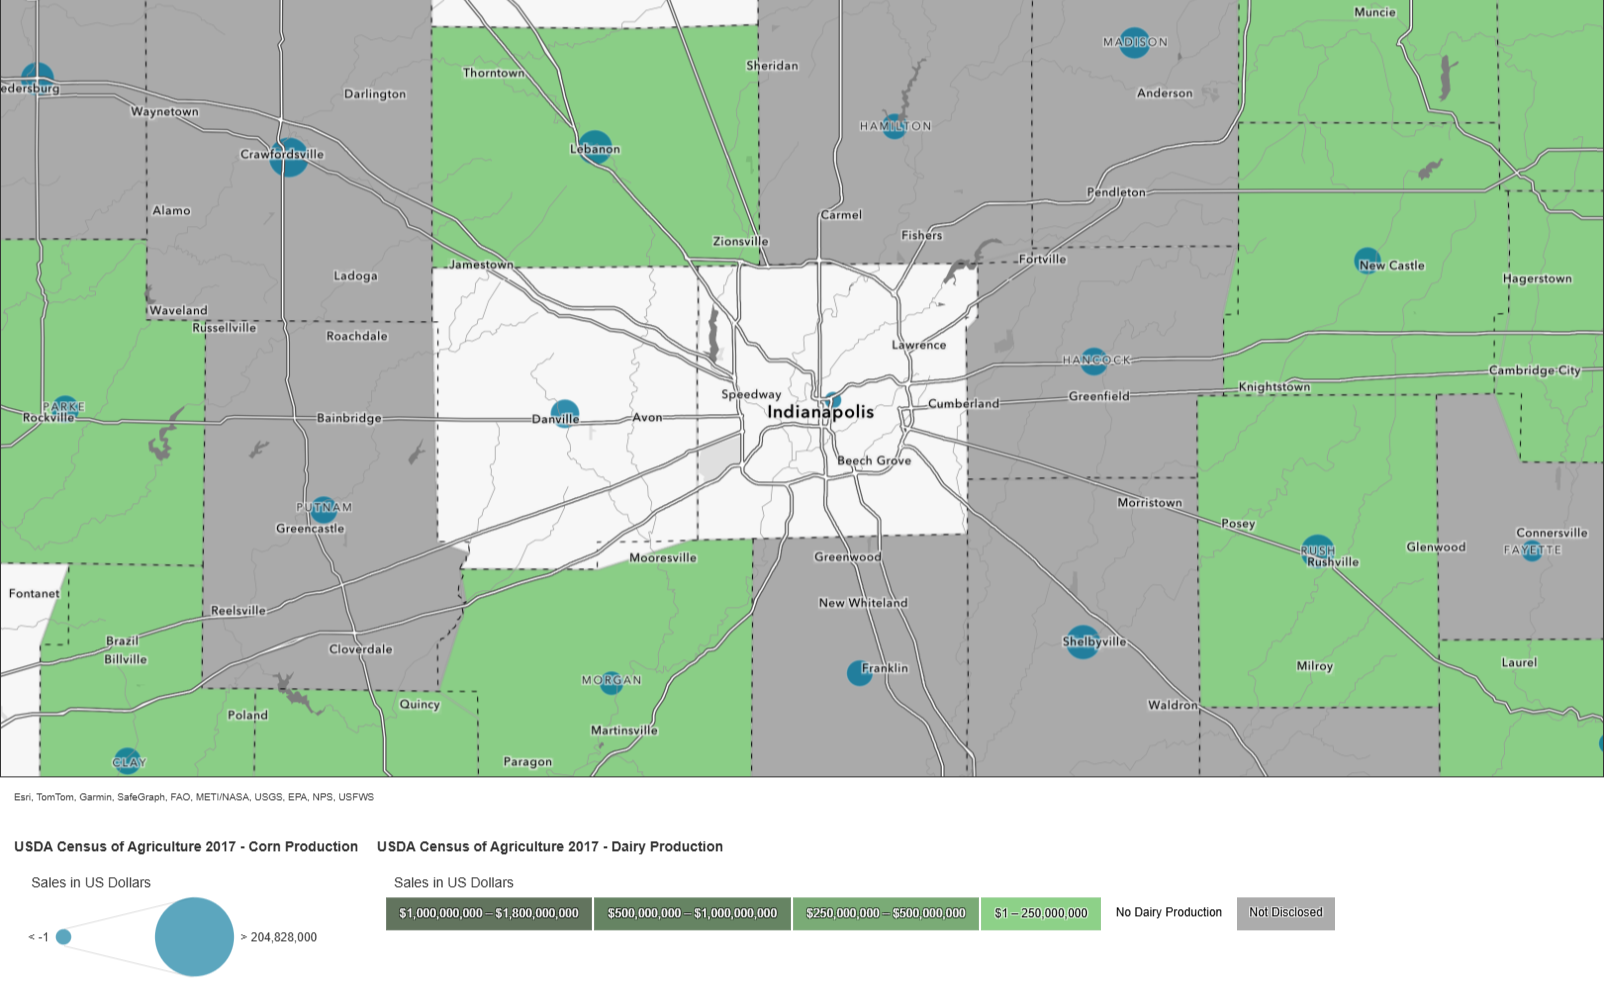
This map shows agricultural production in each county in terms of total sales of corn (circles) and dairy (green highlight). View the full interactive map to see other agricultural commodities like soybean, wheat, cattle, and hogs.
Forests
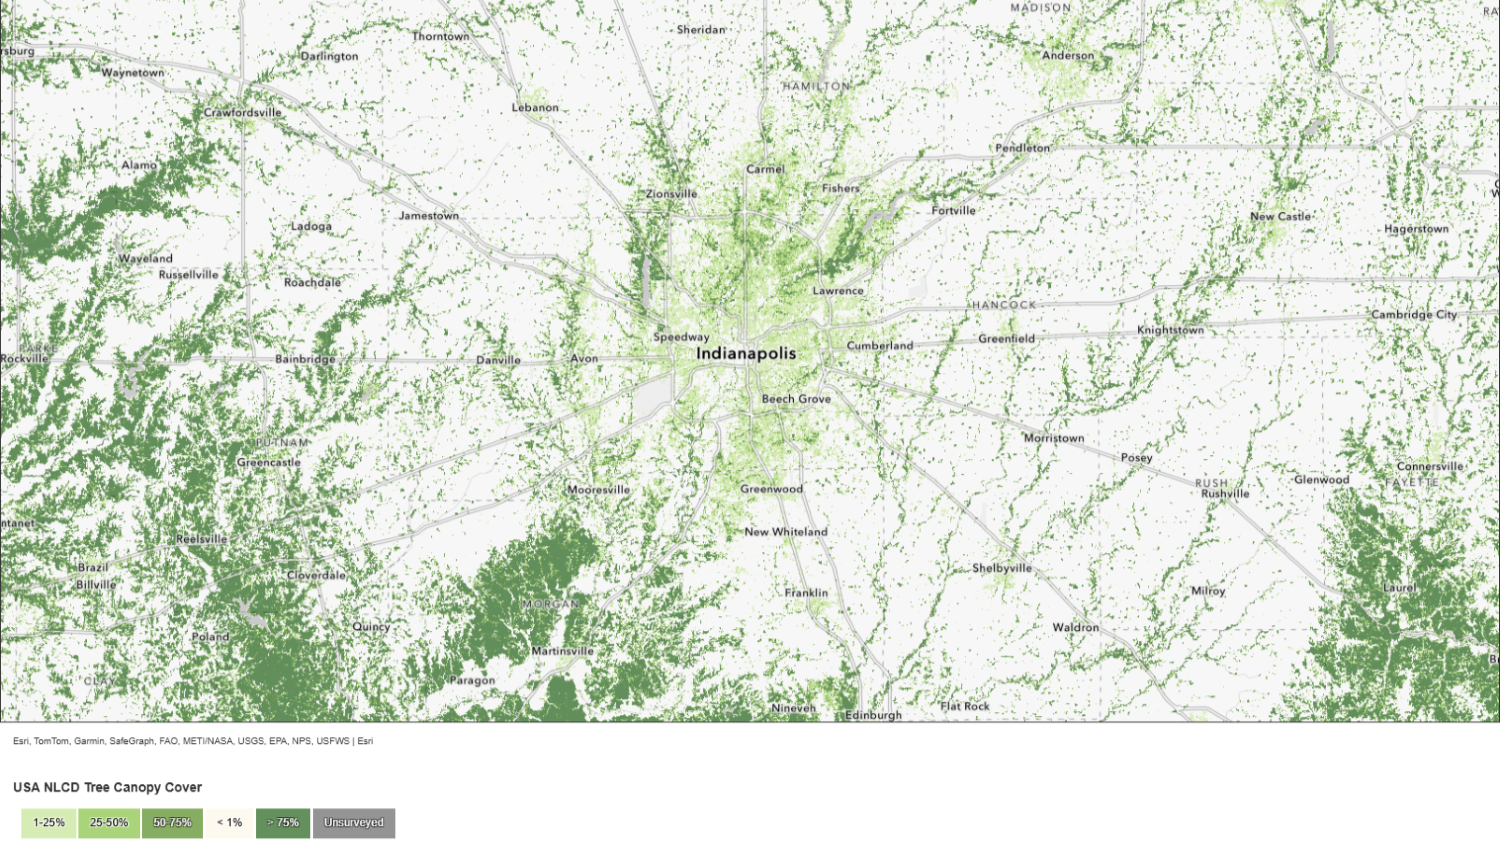
Central Indiana Forest Cover
Forest area in Indiana since 1800 (millions of acres)
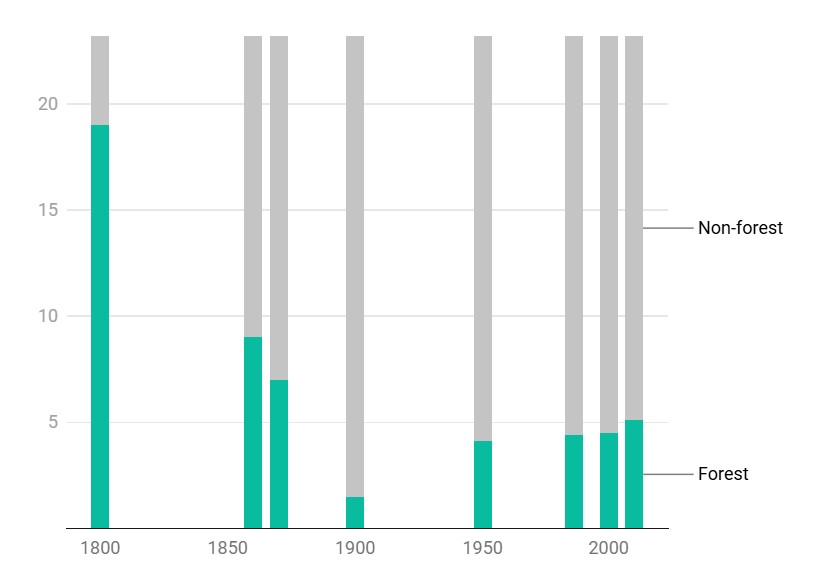
Forest once covered 19 million acres across Indiana, more than 80% of the state’s total area. These primeval deciduous forests had been here thousands of years, replacing conifers as the glaciers receded and the ice age ended.
White settlers deforested for agriculture and logging. In fact, Indiana was the top timber producing state for a time. By 1900, only 1.5 million acres of forest were left.
In the last century, the state’s forests have recovered substantially compared to the low point. 5.1 million acres of forest now cover one fifth of the state. 87 percent of forest land is privately owned. Forest growth from 1900 to 1950 reflects both the increased emphasis on conservation and reforestation as well as the Civilian Conservation Corps’ work to replant forests during the Great Depression. Today forest conservation is an important tool to capture carbon and mitigate climate change.
| County | Forest Acres |
|---|---|
| Boone | 14,279 |
| Brown | 173,843 |
| Johnson | 33,583 |
| Hamilton | 15,653 |
| Hancock | 11,871 |
| Hendricks | 27,076 |
| Madison | 18,027 |
| Marion | 17,270 |
| Morgan | 113,587 |
| Shelby | 19,435 |
| Putnam | 110,291 |
While much of the Indianapolis metropolitan area is urban or agricultural land, substantial forests exist south of Indianapolis. 22 counties in Indiana have more than 100,000 acres of forest, and three of them are in the Indianapolis metropolitan area. Brown County, Morgan County, and Putnam County have the most forested area in the region. In total, the Indianapolis metropolitan area has 550,000 acres of forest.
Atlas Sources
Urban. Data about mixed use neighborhoods are developed by SAVI Community Information System using data from the City of Indianapolis. Community land use models developed by SAVI Community Information System using data from the City of Indianapolis, Indiana Department of Local Government Finance, and Lidar data from U.S. Geological Survey (USGS). Data about urbanization change over time is from LANDSAT data from NASA and USGS. Brownfields are from Indiana Map. Agriculture. Crop statistics are from the U.S. Department of Agriculture Farm Service Agency.
Forests. Forest coverage data is from the National Land Cover Database from USGS. Indiana’s historical forest area is from Indiana Department of Natural Resources Division of Forestry and Purdue University Extension. County-level forest area data is from Indiana Department of Natural Resources Division of Forestry.
Additional Information
Read these Encyclopedia of Indianapolis Entries for more information.